Wiki - FAQ: Application of DFAa1 for exercise prescription and monitoring
Update: Nov 3th 2025
This blog post is mainly based on our own studies and experiences with non-linear HRV analysis and summarizes some of the key points partly (and extensively) discussed from my colleague Bruce Rogers in his FAQ blog during the past 5 years (you can find the link below). We did a lot of studies and literature reviews together, and I am glad that he was there during some stressful times as a driving force to transfer a huge amount of our specific data into the state of research. However, since it is difficult for users to keep track of everything, I have summarized the essential methodological information and background ideas here.
What are fractal correlation properties of heart rate variability?
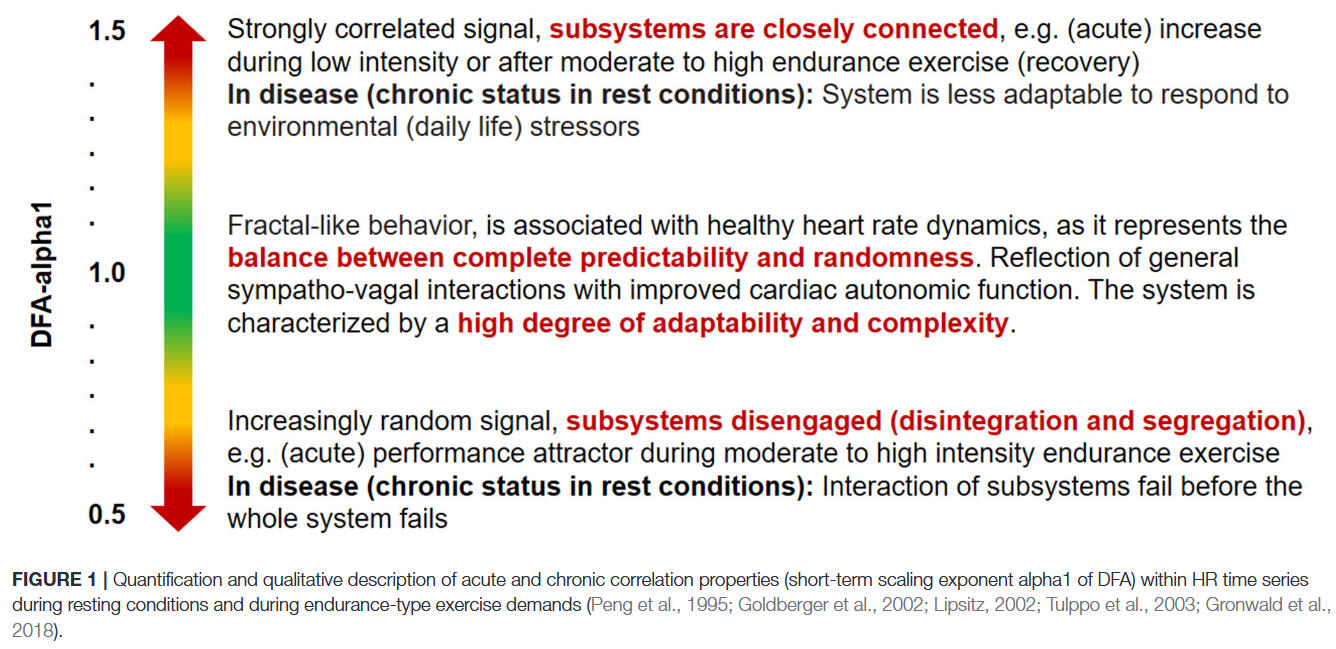
Fractals are considered complex structures that possess self-similarity at various degrees of magnification. Natural spatial examples of fractal structures include coastlines, snowflakes or tree branchings. No matter the scale or magnification, the essential underlying pattern is similar. Fractal behavior of the cardiac beat series is characterized as degrees of self-similarity of the beat sequence over different time scales. Detrended fluctuation analysis and its short-term scaling exponent alpha1 (DFAa1) is based on these fractal cardiac beat arrangements which can also be embodied as “correlation properties” of the pattern over short time spans. To better understand the concept of correlation properties, analogies to a random walk have been used. For example, during a random walk, at each next step, the walker can choose to go either right or left. If the choice the walker makes is not random but based on the previous sequence (series of right or left decisions), the pattern is described as being well “correlated” (this corrwspond to a DFAa1 value near 1.0), since the future pattern is based on the past history. Values above 1.0 denote progressively higher degrees of correlation. But, if each new step is taken with equal, random chances of right or left, an “uncorrelated” pattern exists (DFAa1 value of 0.5). During exercise it has been observed that at low intensity, DFAa1 values are usually in a correlated range near or above 1.0. As intensity rises, DFA a1 declines, passing 0.75 at moderate loads, continuing to drop further past the 0.5 range with increasing exercise intensity (uncorrelated random behavior of interbeat pattern), finally to drop below 0.5 (representing an anticorrelated range) at the very highest work rates. Anticorrelated behavior refers to a pattern that tends to bring the walker back to midline and can be viewed as an immediate self-correction mechanism associated with the potential failure of homeodynamic regulation and can only be tolerated for short time spans. These correlation patterns are felt to be due to changes in sinoatrial pacemaker function under control by the balance between the reciprocal branches of the autonomic nervous system (ANS). During exercise there is both a withdrawal of parasympathetic and enhancement of sympathetic activity resulting in a change of HRV including DFAa1. Therefore, alterations in DFAa1 provide a view of autonomic balance and interaction from rest to severe intensity domains. This autonomic based index of systemic internal load contrasts with established markers of intensity that depend on physiologic subsystems such as cardiorespiratory variables (VO₂, VCO₂), chemical moieties (blood lactate) and measures of external load (speed/power).The figure below summarizes schematically the behavior of the short-term scaling exponent alpha1 of dentrended fluctuation analysis during acute and chronic states of resting and exercise physiology:
Sharma (2009): „The dynamics of the heart rate can also be examined using fractal analysis, and heart rate variability has been found to exhibit self-similarity. The importance of the fractal structure is that the self-similarity extends over many timescales; this confers the effect of memory on the system. The heart is able to repeat beating patterns it has previously used. However it is not ‘remembering’ the rhythms per se; by assuming a fractal structure in time, the system is using a basic law of mathematics to achieve the effect of memory. Fractal structure appears to be related, at least in part, to the presence of chaotic behavior and can be lost by bifurcations towards either order or randomness. Why is the loss of chaotic behavior harmful? Loss of chaotic behavior clearly creates a loss of flexibility in the system. However, it also leads to a loss of information storage and generation. The ability to store and transmit information is lost because random behavior is meaningless, and periodic behavior simply repeats the same information over and over again. This is reflected in the loss of fractal complexity in the heart rate signal; the ‘memory effect’ conferred by the fractal structure is lost. Chaotic behavior is unpredictable behavior, and unpredictable behavior allows for a physiological ‘freedom of expression’; the key to generating useful information is the ability to change. […] many disease states could be regarded as producing a breakdown in complexity, leading to ordered periodic behaviors.“You can also find the first overview about this topic in our published systematic review including the exercise-related literature until 2018:

Is there a potentail application for exercise and training prescription? Do specific values of DFAa1 correspond to conventional physiological exercise thresholds?
Previous studies exploring DFAa1 behavior through progressive increases in exercise intensity have shown that at workloads near the aerobic threshold (surrogates of the first ventilatory or blood lactate thresholds, VT1/LT1), index values fall midway between well correlated (1.0) and uncorrelated states (0.5). Explanations for the association of physiologic breakpoints with correlation properties of HRV can revolve around practical observations (empirically derived from observing DFAa1 vs. VT1/LT1 during exercise ramp or stage studies) but can also be understood from a network physiology standpoint as an integrated concept of autonomic nervous system (ANS) regulation during endurance exercise. Network physiology encompasses multiple neuromuscular, biochemical, peripheral and central nervous system inputs leading to an overall concept of “organismic demand” that is reflected in correlation properties of HRV and consequently in the response of DFAa1. Therefore, it was conjectured that a specific value of DFAa1 may correspond to the aerobic threshold, which would be helpful in sports and exercise science given the importance of this boundary for intensity distribution models in many fields of application. With this objective in mind, several studies were conducted to this date. Results indicated that reaching a DFAa1 of 0.75 during incremental tests was associated with surrogates of the aerobic threshold based on gas exchange or blood lactate concentration data. In addition, it was also hypothesized that another physiologic breakpoint, the anaerobic threshold, could occur at a DFAa1 of 0.5. This value is associated with the transition from an uncorrelated to an anticorrelated pattern in heart rate time series. Since the anticorrelated state is felt to be an autonomic response indicating organismic destabilization, it could correspond to a parallel phenomenon represented by a loss of cardiorespiratory sustainability. In support of this belief, study results of the last years were also very promising showing close agreement with surrogates of the second ventilatory or blood lactate threshold (VT2/LT2). You can find the related studies listed below in the bibliography section.In 2020 we summarized ideas and initial studies to the topic about exercise and training prescription related to correlation properties of heart rate time series during exercise:

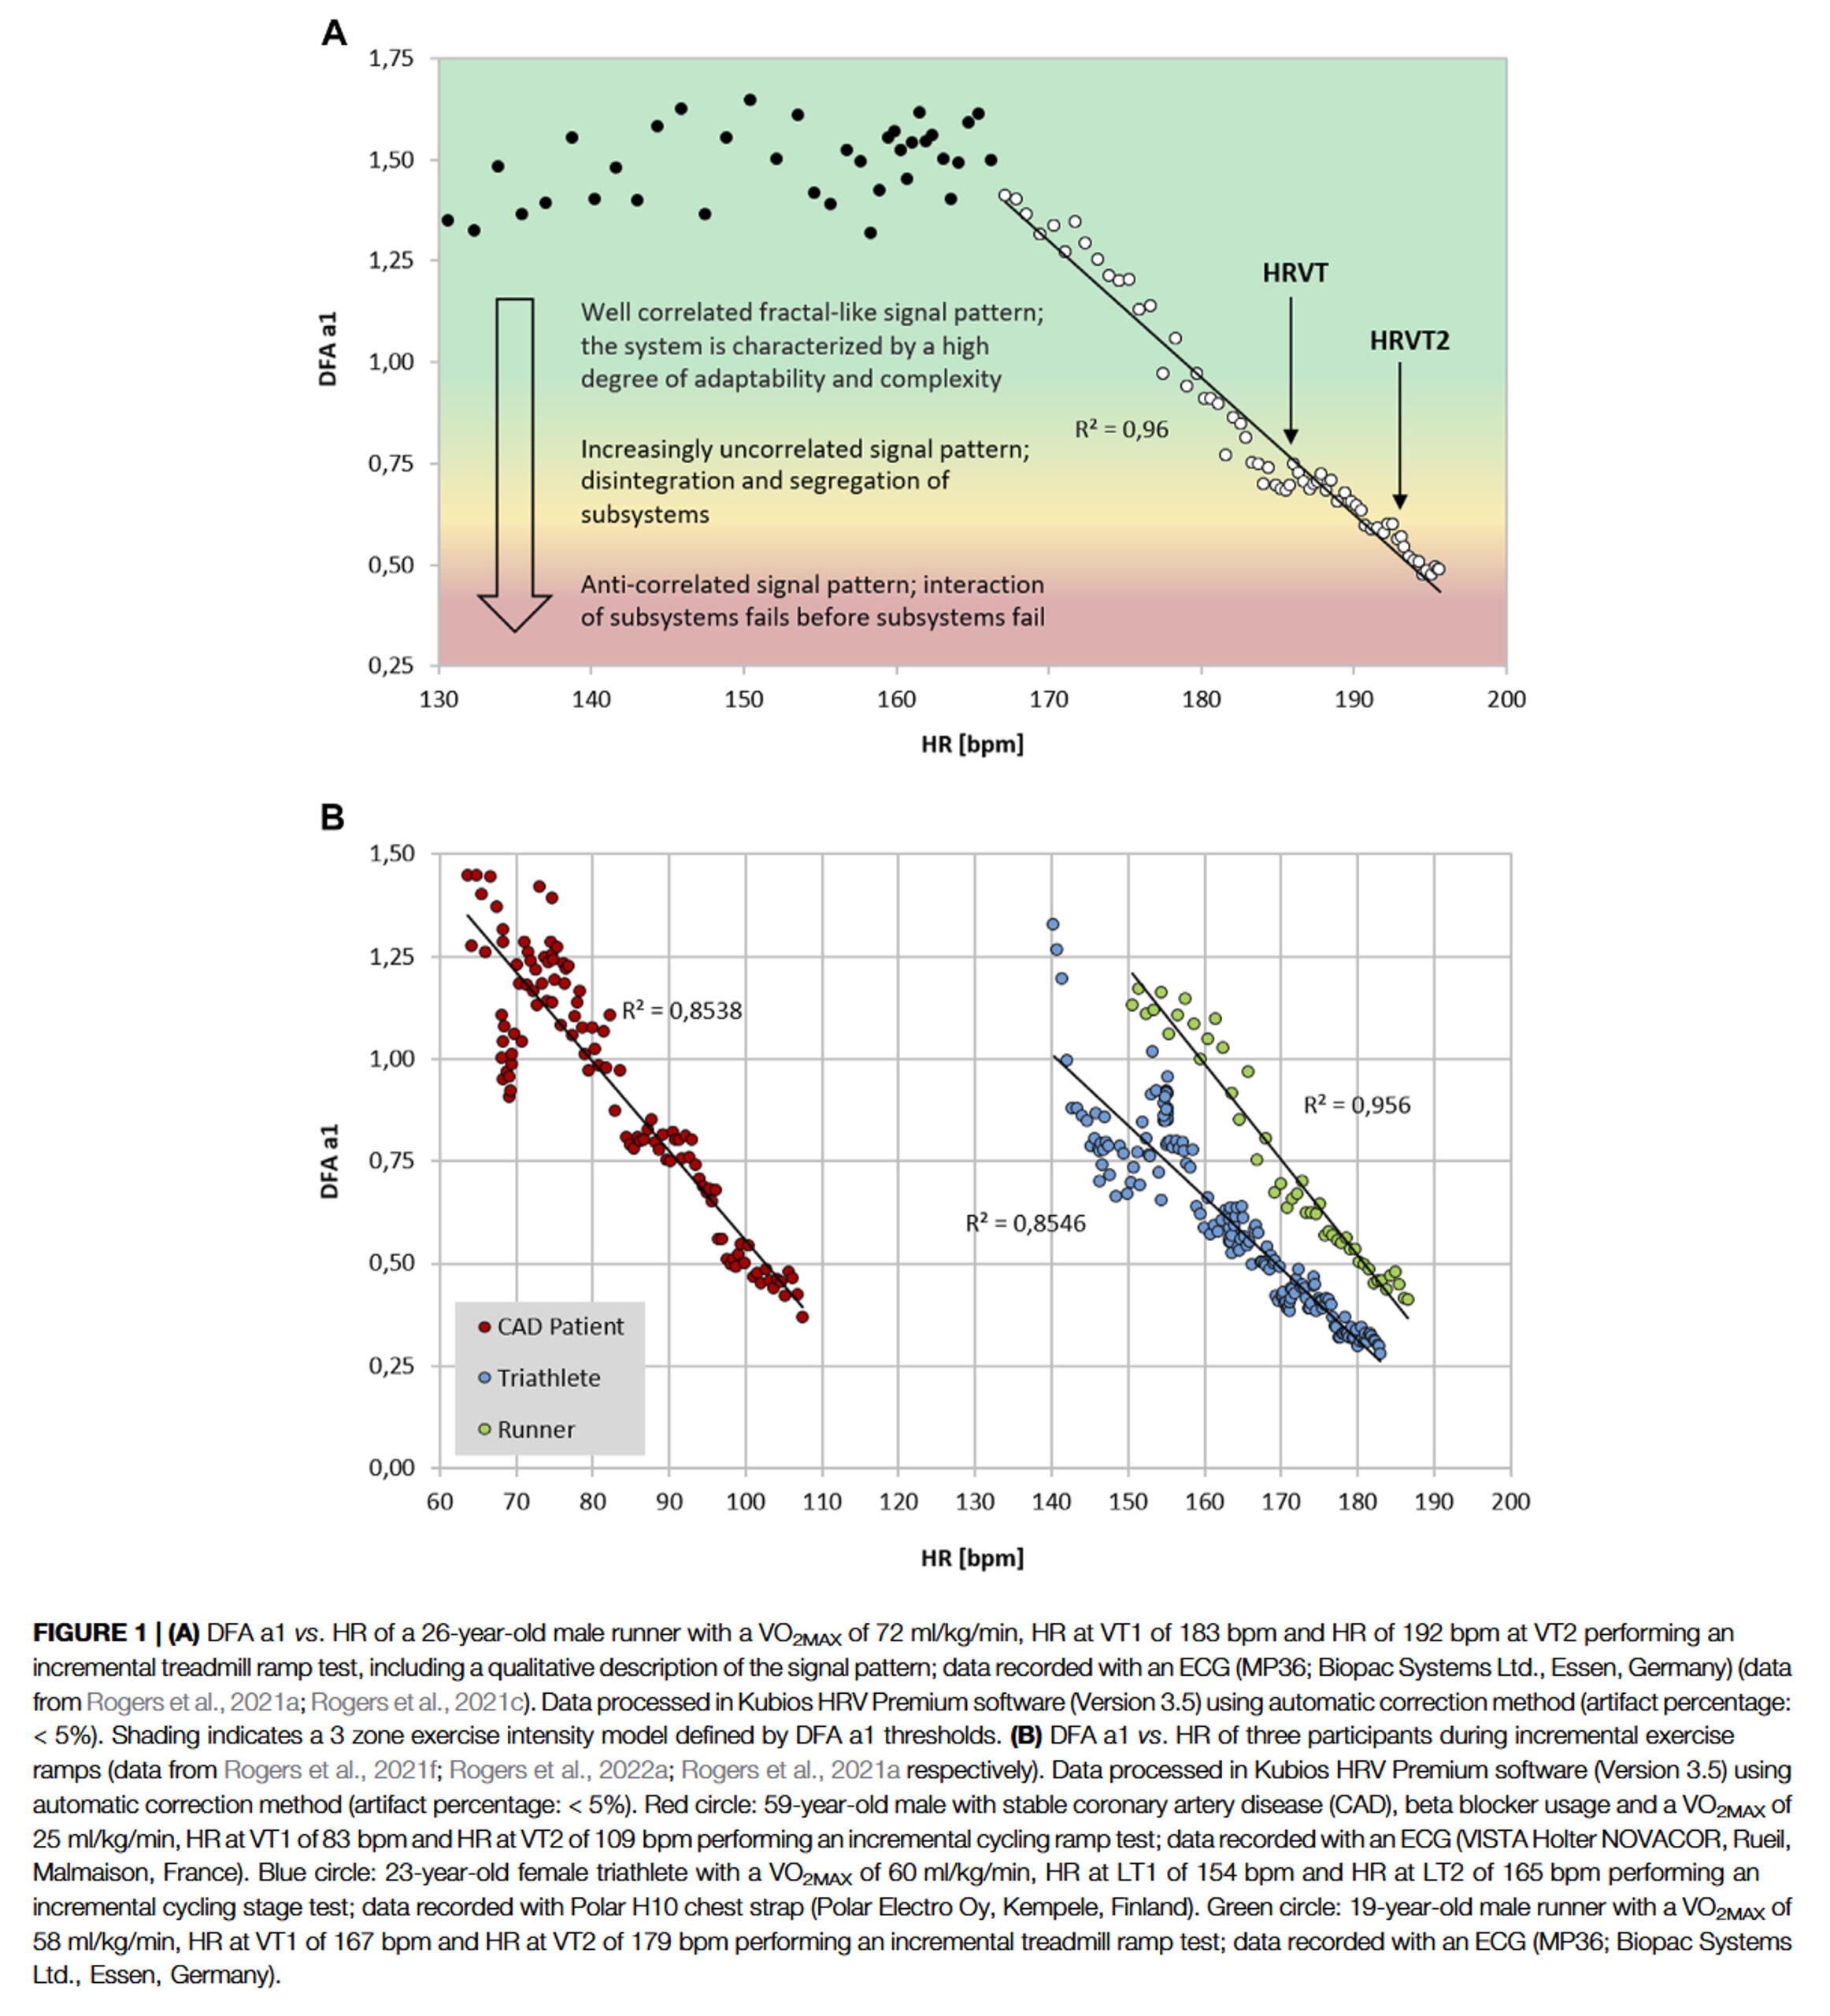
Thus, DFAa1 values of 0.75 and 0.5 may represent a comprehensive solution to accepted physiologic exercise boundaries across a wide spectrum of individuals. In terms of individual participant agreement between HRV and gas exchange or blood lactate derived thresholds, they appear to be of similar magnitude to that of other comparisons of threshold approaches such as blood lactate versus ventilatory parameters, assessment of gas exchange techniques for VT1 determination, comparison of the maximal lactate steady state (MLSS) and functional threshold power (FTP) as well as the muscle oxygen desaturation breakpoint association to the MLSS. Despite the validation with established threshold concepts, it should be kept in mind that the present systemic approach is based on ANS regulation that does not necessarily match perfectly with other concepts based on subsystem parameters (see our recent comment below).The figure below is illustrative of how DFAa1 behaves from easy, moderate, and more severe intensity domains:
You can find the latest overview about the state of research also according to established physiological threshold concepts and related topics for fatigue and durability assessment described below in our published perspective article from 2022:

Are there potentials for refinement of this approach?
In summary, studies by multiple groups using both cycling and treadmill models have shown encouraging results supporting the second HRV threshold (HRVT2, DFAa1 value of 0.5) as a viable marker of the respiratory compensation point (RCP) or second lactate threshold. Additionally, DFAa1 behavior at constant power, during replicate ramp incremental testing and over differing ramp incremental slope protocols has been shown to be reliable. However, in the case of the first HRV threshold (DFAa1 value of 0.75) agreement with the gas exchange threshold (GET) or first lactate threshold, results are somewhat conflictive. Although HRVT1 has been demonstrated to have strong correlation and minimal bias to different markers of the first threshold during incremental tests on the treadmill or during cycling exercise, other studies have not shown such agreement. For example, a report comparing different ramp incremental slopes, three studies involving cycling and one composed of only female participants have been consistent with an overestimation of the first HRV threshold in comparison to traditional markers of a first threshold. However, even though the first HRV threshold was overestimated in some of these trials, the reliability was still good. Another situation that could theoretically lead to HRV threshold divergence is that of participant fitness status. However, this does not seem relevant as studies with high athletic fitness show both good agreement and poor agreement with GET or first lactate threshold approaches. It should be noted that DFAa1 including the first and second HRV thresholds can be affected by HRV artifact correction, recording device, sensor lead placement and preprocessing software which could potentially affect results. However, careful examination of studies evaluating the first HRV threshold to gas exchange or lactate-derived indicators generally employs similar methodology, artifact correction and are even authored by similar research groups.To explore why these differences in the first HRV threshold to the GET or the lactate threshold agreement may occur, an examination of the reasoning behind the HRVT1 concept is evaluated with some kind of adaptive approach. DFAa1 correlation patterns are thought to be due to changes in sinoatrial pacemaker function controlled by the balance between the branches of the ANS. During exercise there is both a withdrawal of parasympathetic and an increase of sympathetic activity resulting in a change of HRV including DFAa1. It was posited that at the first threshold, the cardiac beat pattern would be found in an intermediate zone between well correlated (DFAa1 ≥ 1.0) and uncorrelated (DFAa1 = 0.5) behavior, which was numerically set to 0.75. In addition, it was conjectured that a second threshold would correspond to a second DFAa1 threshold of 0.5 (HRVT2), which represents a random interbeat pattern. DFAa1 values below 0.5 correspond to “anticorrelated” patterns representing an autonomic response indicating organismic destabilization consistent with exceeding a metabolic steady state. More careful inspection of prior data indicates that some individuals have a DFAa1 well above 1.0 early in the ramp incremental, with these values still considered strongly correlated. Since the initial DFAa1 in some individuals may be higher, the midpoint between well correlated and uncorrelated values (defining the first HRV threshold) in these cases would be shifted to a higher DFAa1 as a mathematical correction. For example, if an individual had a DFAa1 of 1.5 early in the ramp incremental, the midpoint denoting the first HRV threshold would be 1.0 with the associated heart arte and oxygen consumption calculated accordingly. This suggests that the lack of agreement that some studies observed between the physiological responses observed at the first threshold might be explained, at least to a given extent, by the methodological approach used for the first HRV threshold determination.Therefore, in an attempt for further individualization the effects of modifying the value of DFAa1 used for determining the heart rate and oxygen uptake associated with the first HRV threshold, from a fixed value of 0.75 for all participants, to that of one based on individual DFAa1 ramp characteristics were evaluated. Findings indicate that by using a custom first HRV threshold derived from the DFAa1 value midway between the maximal seen during the early portion of the ramp incremental and 0.5, the positive bias of heart rate and oxygen uptake observed using the conventional approach was eliminated. Furthermore, since the line of regression used for determining the new calculation was unchanged from standard methodology, the tight relationship between the HRVT2 and RCP was maintained.While the use of this custom approach calculation did improve overall agreement with the GET, variation still exists on an individual basis. This may partially relate to the underlying conceptual differences between a marker of ANS response and measures derived from gas exchange indicators which may diverge in some individuals. HRV in general arises from the competing influences of the stimulatory sympathetic and inhibitory parasympathetic branches of the ANS on the sinoatrial node resulting in fractal correlation behavior of the cardiac beat sequence. It is theorized that a potential rationale for this behavior is an attempt by the cardiovascular system to best cope with a rapidly changing environment. These environmental changes affect multiple neuromuscular, biochemical, peripheral and central nervous system inputs leading to alterations in “systems integration”. Within this framework, various physiologic responses and cardiovascular advantages may exist behind the changes seen in correlation patterns due to increasing exercise intensity and overall organismic demands.Continued research into combining other noninvasive surrogate markers with the HRVT such as muscle NIRS desaturation breakpoints, or ECG derived respiratory rate thresholds appears reasonable despite the increased cost or complexity involved. As a consequence of the different underlying physiological concepts involving cardiorespiratory thresholds and markers of ANS status, individual differences may remain between traditionally used threshold concepts and ANS linked HRVTs even with further advances in HRV methodology. Additionally, even established methods such as gas exchange based respiratory responses have both error, device bias and day to day variations to some degree.While further research is needed in this regard, and due to a further validation study, we felt the need to describe the basic concept again in a comment in which we clarified specific points regarding the signal theoretical background and signal processing.

Careful data assessment and treatment are mandatory in HRV analysis during exercise to control signal-to-noise-ratio, artefact detection/correction and large among-subject variability and restrict external random noise as good as possible. However, these aspects are also relevant to other concepts of threshold-based exercise intensity partitioning. In addition, and most importantly, when using a complementary method such as DFAa1 (or other non-linear HRV approaches) during exercise, it seems necessary to consider and adhere to the underlying theoretical and methodological assumptions of that method. In this case, DFA during exercise is theoretically rooted in systems biology, or more specifically, Network Physiology of Exercise (NPE), which defines exercise regulation as a complex, goal-directed, and context-dependent dynamic mechanism in response to continuously emerging organismic and environmental demands and focuses on the interaction dynamics of complex adaptive systems (CAS). From the perspective of the NPE approach, DFAa1 of HRV during exercise could serve as a method to assess the stressrelated complex neuro-autonomic regulation of an athlete, which involves several hierarchically and heterarchically organized control circuits, operating on different time scales by capturing short-term correlation properties of heart rate time series. Based on the signalclassification of physiological time series, DFAa1 marks the change from fractional Brownian Motion (fBM, > 1.0) to fractional Gaussian Noise (fGN, < 1.0), with 0.75 corresponding to the halfway decay within the fGN domain, which is a common marker in both dose–response modelling and risk stratification, and 0.5 representing the total loss of the complex interrelated organization of the cardiovascular control circuits involved. Taken together, DFAa1 during exercise rather demarcates a transitional change in physiological control. Relating these theoretical and methodological aspects to the statement that there are no clearly identified physiological phenomena associated with DFAa1 values of 0.75 and 0.5, it seems clear that this statement is not true when placed in the context of NPE. The additional statement that the association of biological or physiological laws with fixed numbers is always risky, using the historical concept of Mader et al.’s fixed blood lactate concentration (BLC) threshold of 4 mmol/L as an example, is also rather misleading. In contrast to the fixed value of 4 mmol/L, which had no meaning in itself, but rather served as an estimate of maximum lactate steady state using a particular protocol and type of exercise, the DFAa1 fixed values are directly related to signal classification of physiological time series of CAS. In this context, it could be argued that the calculated DFAa1 values may reveal different scaling behaviors with different exercise intensities and/or durations which might imply a dynamic modification of the method (e.g. dynamic DFA), but the interpretation from an NPE perspective remains related to physiological signal classification and a universally designed internal calibration framework of complex system dynamics. Whether individual markers of, for example, the kinetics of DFAa1 during incremental and/or constant load exercise might have additional value remains an open question that could be addressed in future research. Consequently, the relative proximity of DFAa1 values during incremental exercise to metabolic thresholds, which mostly represent a deviation from the linearity of gas exchange and/ or BLC-related values, is valuable because it provides a first impression of whether such a complementary method is consistent with, and could be used like exercise intensity prescriptions from metabolic thresholds that have a long tradition in results-proven training practice. However, the metabolic perspective of gas exchang and/or BLC-based threshold concepts does not represent a gold standard for an NPE-based approach that evaluates complex physiological interaction on different time scales. Thus, even a mismatch between these approaches does not per se disqualify DFAa1 for exercise intensity prescription in general. A true evaluation of exercise prescription models should rather use a longitudinal comparison of different methods and show which of them more easily translates from incremental exercise testing to (prolonged) endurance training in the field, provides better perspectives for day-to-day fine tuning in different environmental settings and most importantly supports optimized training adaptations in the relevant physiological and/or performance outcomes.Second, for DFA during exercise indeed a careful and rigorous methodological approach is mandatory, and this does not only involve the necessity for rigorous standardization and transparent reporting of the general DFAa1 settings (e.g., Kubios HRV software preferences: smoothness priors detrending: lambda = 500; scaling window DFAa1: 4 ≤ n ≤ 16; time-varying window size: 2 min, grid interval: 5 s). One possible reason for bias might also be attributed to the choice of start and end point of linear regression that should capture the rapid near-linear decline from values near 1.0 to approximately 0.5, which might have a strong influence on the slope of the regression line and thus the corresponding values of power/speed or heart rate at fixed DFAa1 values of 0.75 and 0.5. The possibly large inter-individual differences in the DFAa1 decay profiles and the already highlighted importance of DFAa1 data point selection and regression fit further support the relevance of start and end points for regression. A possibility to reduce this inherent subjective bias might be the use of multiphasic dose–response modelling which for example led to highly superior goodness of fit (increased by > 25%) in our most recent study on DFAa1 in prolonged running and uses the whole DFAa1-exercise intensity curve without the need for a selection of start and end point. In this context, further methodological attention needs to be drawn to the fact that values of the time-variant DFAa1 outcome of Kubios HRV software are automatically time-shifted with half the size of the chosen sliding window.Finally, a general notion should be made on the beauty of simplicity that is inherent to Occam’s razor. Although this rationale is always appealing, Occam’s razor has a very limited role in systems biology and NPE where interaction dynamics of CAS with multiple (redundant) feedforward and feedback control loops are rather the rule than the exception. Here, oversimplification might even hinder scientific progress (Hickam`s dictum) as too simplistic methods and reasoning may not reveal anything about the ‘true’ regulation of CAS, which means that specific methods for systems biology are mandatory. In summary, the application of DFAa1 of HRV during exercise requires a rigorous methodological approach that addresses the inherent problems of signal-to-noise ratio, artifact detection/correction, and between- and within-subject variability, as well as an acknowledgement of its strong theoretical roots in systems biology and/or NPE. When used with appropriate methodology and adequate physiological rationale for CAS, the method could shed complementary light on endurance exercise monitoring in addition to standard metabolic approaches for both exercise (intensity) prescription and durability assessment. In this regard, DFAa1 during exercise should be further evaluated as a complementary approach in NPE, rather than being valued for its ease of use in approximating metabolic thresholds or discarded as not being interchangeable with these concepts.
Can DFAa1 be used as an index of fatigue, daily training guidance or durability?
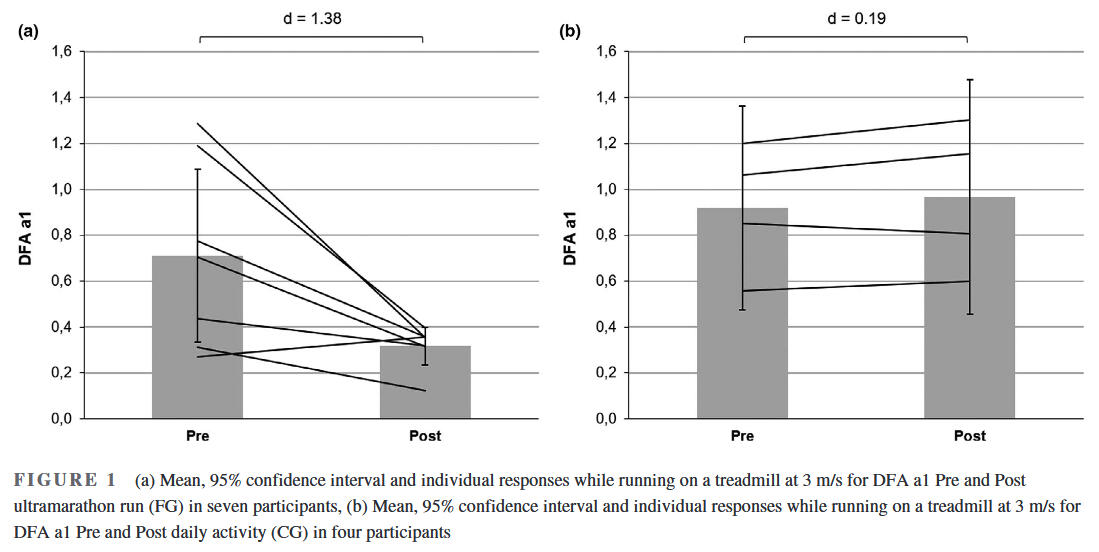
Multiple measures of endurance exercise induced fatigue have been explored, none are of practical value while in the midst of an exercise session or race. There are also questions regarding the validity of heart rate drift as a sign of fatigue during exercise. Heart rate drift appears to be a complex phenomenon that can normalize or even reverse with very long endurance efforts. Established performance indices or biomarkers such as counter movement jump height, running economy, muscle enzyme elevation like creatine phosphokinase, salivary hormones, markers of substrate availability, blood lactate concentration and cortical activity are mainly used after the activity, during interval sessions or as monitoring tools at periodic times during standardized rest conditions. While regular HRV monitoring at rest has been proposed as a means to prevent functional overreaching and assess baseline autonomic balance, no HRV index has been shown to have the ability to demonstrate fatigue while performing exercise. Since DFAa1 possesses dynamic range through all exercise intensity zones, a divergence between an indicator of autonomic status and measures of external load (e.g., power/pace) could potentially be used as an indication of fatigue while still performing the activity. For instance, if DFAa1 is usually 0.75 at a pace representing the aerobic threshold in a well-rested individual, would it be different after lengthy endurance exercise? To this date, there are already multiple studies that show the observation of inappropriately suppressed DFAa1 values at an exercise intensity previously shown to be associated with well correlated values, which can be potentially viewed as an autonomic indicator of fatigue. For example, following an ultramarathon, DFAa1 exhibited suppressed behaviour during constant low-intensity exercise, also associated with reduced countermovement jump scores indicating neuromuscular fatigue. Further, in a pilot study it could be determined that the relationship between DFAa1 and power output during low-intensity warm-up may serve as an indicator of autonomic status and residual fatigue in triathletes, thereby DFAa1 being valuable to inform daily training adjustments. While this research provided insights into the usefulness of DFAa1 and fatigue assessments, the study involved only 11 athletes and a follow-up of 36 hours. Interestingly, this is the only study which investigated the effect of exercise on DFAa1 not directly after exercise cessation, but in the following day(s) as heart rate time series structure needs to reorganize and return to pre-exercise values. You can find an overview in the subsequent bibliography of this blog post.Display of DFAa1 during low-intensity submaximal running bouts prior and after an exhausting ramp until voluntary exhaustion:

The first mentioned study with runners immediately post a simulated ultramarathon:

The first first study investigating residual effects after different workouts the next day:

In a monitoring purpose the usage of DFAa1 may help inform an athlete about their recovery from previous training sessions. It has become commonplace for individuals to monitor and track resting HRV as a method to direct daily exercise intensity and volume. Unfortunately, resting HRV requires a regular day-to-day monitoring routine including standardization (e.g., time of day, nutrition) and logistically may not fit into an irregular schedule. As resting HRV is a reflection of autonomic balance post exercise, the observation of DFAa1 early in the upcoming exercise session with some kind of standardization (e.g., during a warm-up setting) could also provide similar clues. In other words, DFAa1 relative to power/pace could provide insight into current systemic recovery status while still in a low intensity warm-up stage. If relative suppression of DFAa1 is seen at a low exercise intensity previously associated with well correlated fractal patterns, it can be interpreted as signifying inappropriate autonomic balance. With this in mind, it is also important to realize that DFAa1 based physiologic exercise threshold testing performed in a fatigued, overreached or ill individual may not be similar to testing when healthy and well rested.Extrapolation of the observation above could also lead to usage of DFAa1 as a marker of both “exercise durability” and as a method for daily decisions about “training readiness”. Athlete “durability” was described as “the time of onset and magnitude of deterioration in physiological-profiling characteristics over time during prolonged exercise”. In other words, durability is an assessment of fatigue related reduction in performance, as opposed to standard measures of athletic fitness such as maximum oxygen consumption or MLSS. To assess durability, quantifying the starting point and degree of performance decline due to fatigue is needed. Leveraging DFAa1 as an index of overall “organismic demand” in conjunction with simultaneous measures of external exercise load could help assess this performance decline from an ANS perspective. In this context, DFAa1 would reflect changes/deterioration in autonomic balance seen at a particular pace/power during exercise. Since DFAa1 values span the spectrum of exercise intensity, the assessment of autonomic imbalance can be made whether the internal load condition is high or low.An example of this is shown in in the figure below where DFAa1 is markedly suppressed at a pace well below the VT1 after a simulated 6-h ultramarathon-run without changes in heart rate. In a second example, there was no major change in DFAa1 behavior during incremental cycling exercise before and after a 2-h session performed at 65% of the LT1 power in a former Olympic triathlete. In the last example, DFAa1 shows downward drift at an intensity just below the VT1 during a 15 km cycling session with stable heart rate in a recreational athlete. These three cases demonstrate the potential of DFA a1 to serve as an independent and systemic marker of fatigue and durability. The former Olympic triathlete showed no sign of DFAa1 “deterioration” after 2 h cycling at a low intensity, however the recreational athlete had declining DFAa1 values at a stable power below the aerobic threshold, illustrating the potential interactions of inherent fitness level and external load over time:

Meanwhile a few studies have also shown the potential of DFAa1 for some kind of fatigue and durability assessement during prolonged endurance exercise. You can read one of our studies below. In regards of the FLUSH-Model from Guillaume Millet (as one of a few interesting shematic and holistic views specific to endurance exercise demands) we try to find an obejctive systemic measure of a global internal load metric with increasing demands and fatigue; to this date only rating of perveived exertion (RPE) as a subjective measure is able to give us valuable information in this direction; in our study referenced below the data showed also high value of respiratory frequency as objective internal load metric controlled at the interface of the central autonomic network (CAN):


In future studies looking at DFAa1 behavior at low to moderate intensities over longer time spans, incorporation of multipoint (rolling) averaging or longer measuring windows may lead to better comparative insights. Meanwhile, several valuable studies have been published on continuous endurance exercise, establishing a link between DFAa1 and prolonged exercise sessions. You can also find these studies in the bibliography below. Additionally, it will be important to examine the day-to-day variation and reproducibility of the DFAa1 versus external load relationship to determine what degree of precision can be expected for monitoring purposes involving fatigue and durability.
A case for acute recovery monitoring after exercise?
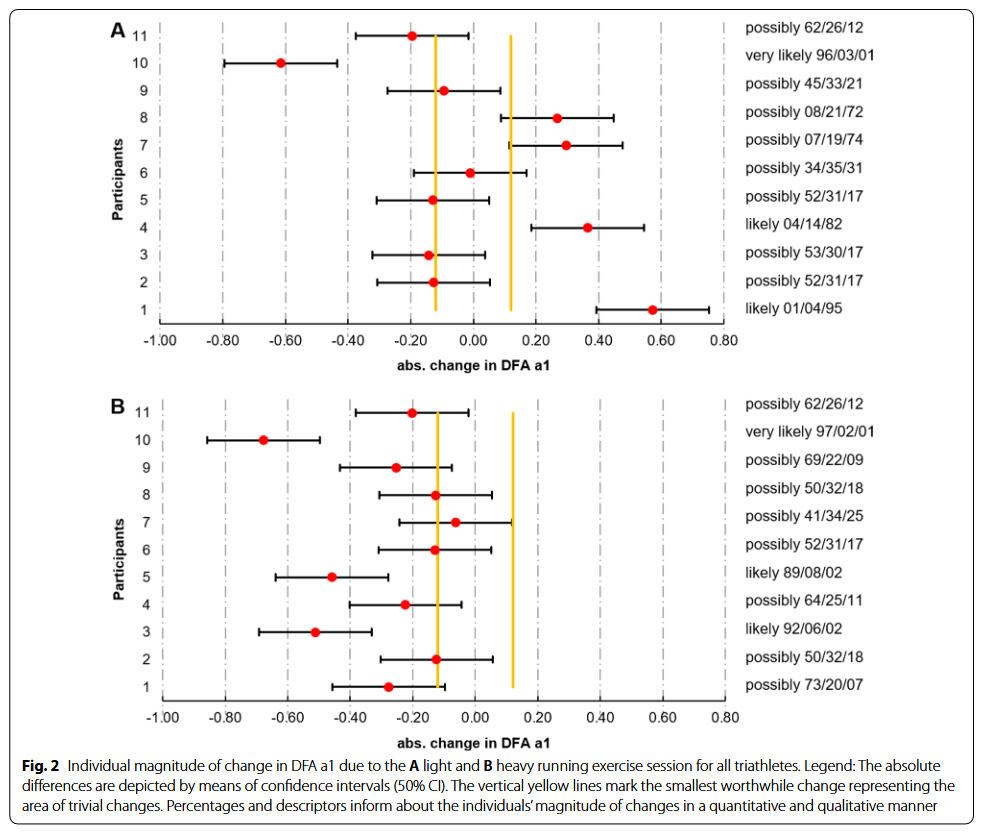
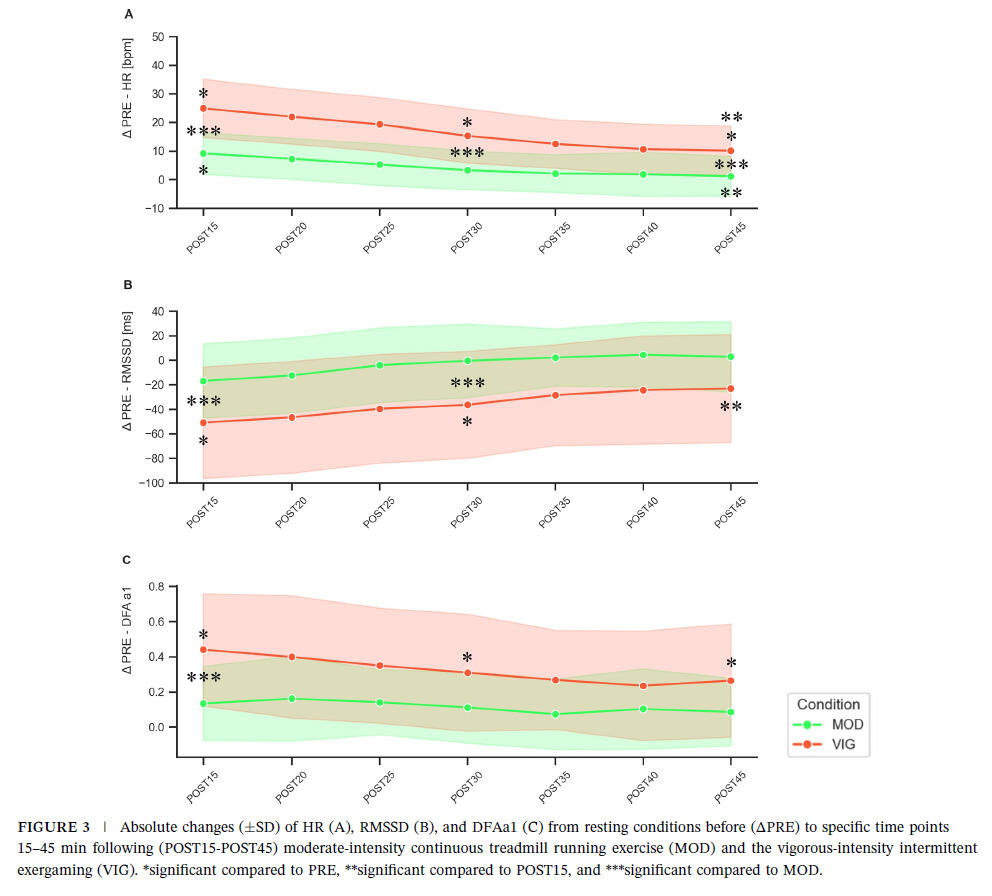
The monitoring of postexercise linear and nonlinear HRV metrics as a tool for fine-tuning monitoring processes and HRV-guided training remain relatively underexplored. However, it holds significant potential for endurance athletes who undertake high volumes, varied exercise intensities, and/or multiple training sessions per day. This approach can complement resting physiological analyses providing a more comprehensive understanding of recovery and autonomic nervous system regulation.Our new study adds to the state of research of exercise recovery and shows that exercise in the vigorous intensity domain transiently delays parasympathetic reactivation. We also provided an overview of the state of research according to correlation properties of HR time series analysis after exercise.A greater homeostatic perturbation induced by the higher exercise intensity results in delayed reorganization and decreased values of linear HRV metrics during passive recovery. The results also confirmed the assumption that DFAa1 displayed a stronger correlated reorganization and overcompensation after the more intense exercise bout. Higher correlation properties may indicate more order and interaction of the involved control processes managing recovery.This suggests a stronger systemic control to process the demands of higher exercise intensities within a homeodynamic understanding of the organismic regulation. Assessing standardized postexercise linear and nonlinear HRV metrics as a monitoring tool could be a valuable addition for endurance athletes, aiding in the evaluation of regular training sessions, and complementing resting analysis. Further research is needed to verify its potential in guiding the structuring of microcycle and daily programming tailored to individual cardiac reactivation kinetics.

Are there applications for DFAa1 computation and real-time display?
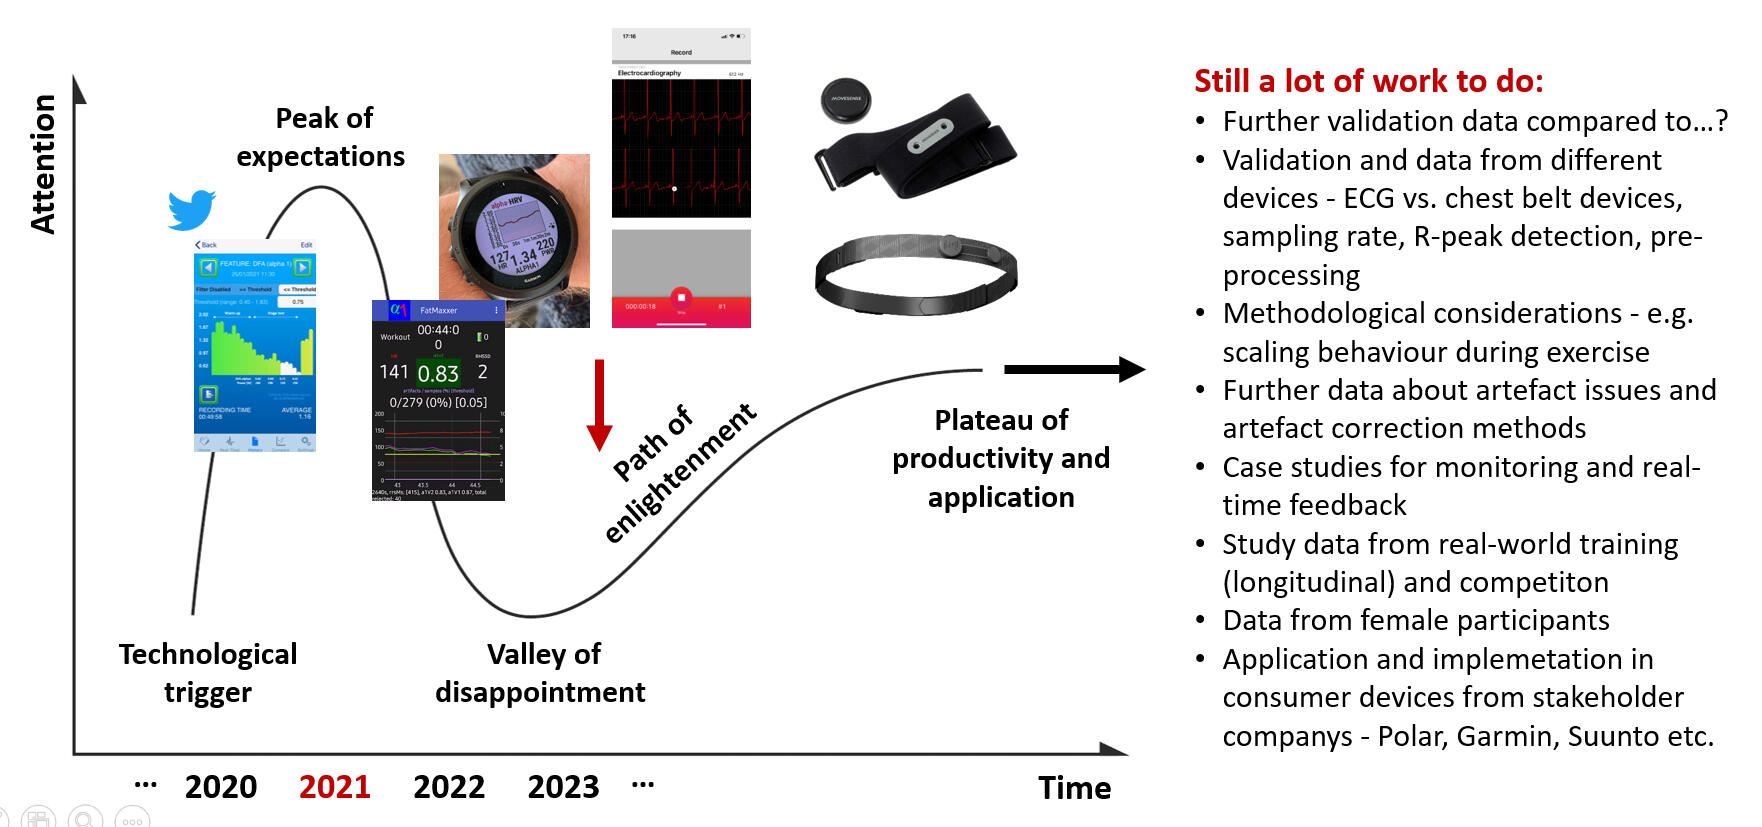
While DFAa1 is an appealing physiologic biomarker, important factors such as accurate, low cost calculation and simplified data display are needed for widespread consumer usage. Over the last years, several web and smartphone applications have been developed to display DFAa1 independently of analysis software such as Kubios HRV. Websites such as “Runalyze.com” and “AIEndurance.com” utilize similar preprocessing (smoothness priors detrending), artifact correction (threshold approach) and time varying DFAa1 calculation methodology as Kubios HRV Premium (now „Scientific“) for retrospective session analysis of DFAa1. Standard Garmin.fit files can be uploaded for analysis with estimation of HRVT based on linear regression using time varying computation of power/heart rate and DFAa1. The AIEndurance platform also tracks previous warm-up session DFAa1 to power relationships to estimate “readiness to train” as well as overall session deterioration in DFAa1 per unit power for estmates of “durability”. Also of note is the availability of low cost smartphone apps that can process heart rate monitor data in real-time, providing a live view of DFAa1 status during exercise activities. A previous report described the use of the smartphone app “HRV Logger” (Android and iOS available) in both threshold determination and implementation of a polarized session program in a former Olympic triathlete. This particular application displays DFAa1 every 2 min sequentially without rolling window recomputation and slighlty other preprocessing settings of the raw signal. A newer app called “Fatmaxxer” (Android available, https://github.com/IanPeake/FatMaxxer) enhances DFAa1 measurement capabilities even further. It includes features present in Kubios HRV such as similar preprocessing (smoothness prior detrending), threshold correction and recalculation of DFAa1 e.g., every 5 s using 2-min rolling windows (time varying analysis: window width of 2 min, grid interval of 5 s). For both applications a Polar H10 for recording RR intervals is recommended. Lastly, “alphaHRV” a DFAa1 data field for Garmin devices (watches and cycling head units; without a smartphone being needed) is available in beta testing (https://apps.garmin.cn/apps/1a69b10a-1d31-4afe-a32f-6a579ae20d9f). It reports DFAa1 along with artifact percentage every second in real-time based on the prior 200 beats, bringing this metric to potentially millions of Garmin units. Although it is using an alternate method of preprocessing and a measurement window of 200 beats (instead of 2 min), the data is close to that of the Kubios HRV software and updates each second (user defined). Artifact percentage is displayed and there is a 2 min running graphical display of DFAa1 on the selected device. Garmin.fit files will contain this data so you can extract for further analysis. „Garmin Connect“ treats this like any data field. Having the ability to display accurate DFAa1 in real-time during an exercise session opens up a myriad of potential options, from on the spot threshold determination to assessment of fatigue status at the start (for daily directed training) as well as during prolonged exercise sessions (durability assessment and/or training interventions).By clicking on the picture below you can see our first applications of real-time usage of DFAa1 with the HRV Logger app published on the blog post page of the British Journal of Sports Medicine:

Development of Dynamical Detrended Fluctuation Analysis (DDFA)
Dynamical Detrended Fluctuation Analysis (DDFA) is a modern method for analyzing heart rate variability (HRV) that enables a more precise and dynamic assessment of how the body responds to physical demands during exercise. Unlike traditional DFA, which evaluates HRV in fixed time windows and produces static results, DDFA takes into account time- and scale-dependent fluctuations in the RR intervals. A practical application of DDFA can be found in Suunto’s ZoneSense technology, which uses the DDFA index to display training intensity zones directly on Suunto devices. During easy, aerobic efforts, the DDFA index typically stays positive (around 0.0 to +0.4). When it drops below an individually determined threshold, it indicates a shift toward the anaerobic zone. The method was developed by researchers at the University of Tampere and the company Monicardi, validated using large datasets such as the FINCAVAS project with thousands of participants. First studies have shown that DDFA may provide valuable insights not only for athletes but also in medical contexts. Although promising, DDFA is still under active development. Short, high-intensity intervals are more difficult to capture because the method requires stable HRV data. Nonetheless, DDFA may represent a new approach to monitoring physiological demands and training intensity in real-time.


Which limitations and pitfalls exist?
Artifact correction and recording device bias
Although the state of research related to DFAa1 and endurance exercise is encouraging, there are still potential limitations for this approach. Both the common occurrence of missed beat artifact and possible RR recording device bias could lead to erroneous DFAa1 values. Previous studies looking at missed beat artifact correction bias indicated variable effects on DFAa1 and none examined how HRV based exercise thresholds could be changed with increasing artifact presence. In addition, the popular software Kubios HRV has two distinct varieties of artifact correction methodology (automatic and threshold artifact correction), whose potential influence with respect to DFAa1 calculation or physiological thrshold determination should be evaluated. To better understand these issues, we examined the effect of introducing progressive amounts of dropped signal artifact (by randomly deleting QRS complexes) to induce levels of 1, 3 and 6% artifact in otherwise ideal ECG tracings. Both Kubios HRV automatic and medium threshold artifact correction methods were evaluated for bias. A negligible amount of bias was produced by 1 and 3% artifact correction with both methods. A larger amount of proportional bias (positive bias at low DFAa1, negative bias at high DFAa1) was seen with the threshold correction method at the 6% artifact level, rising to a maximum of 19% bias at very low, anticorrelated values of DFAa1. Fortunately, despite the varying degrees of bias seen, the heart rate at HRVT level did not differ between control (no artifacts) and any of the artifact groups or correction methods by more than 1 bpm. This is certainly reassuring regarding practical usage of HRV based exercise threshold determination and other fields of application.Another aspect of the mentioned study about artefact correction addressed whether the HRVT calculated from ECG was equivalent to the HRVT obtained by a chest belt (Polar H7) worn simultaneously only recording RR intervals. There was a small degree of bias at HRVT seen with the Polar H7, 4 bpm lower than that of the ECG. Several possibilities exist as to why there may be differences between devices. DFAa1 is a measure of RR related fractal correlation properties and therefore, specific patterns in the heart rate time series. Hence, a loss of RR resolution may lead to a failure to discern these patterns, leading to mistaken measures of fractal correlation properties. In support of this, a reduction in R peak detection precision has been shown to affect DFAa1 determination. According to Polar documentation, the R peak detection precision was enhanced in a next generation device, the Polar H10, implying that there was room for improvement in this property.Here is an example of a premature beat (APC) recorded with a single channel ECG tracing (Movesense Medical chest belt module) and processed via Kubios HRV Premium software; this results in a short and longer RR interval:
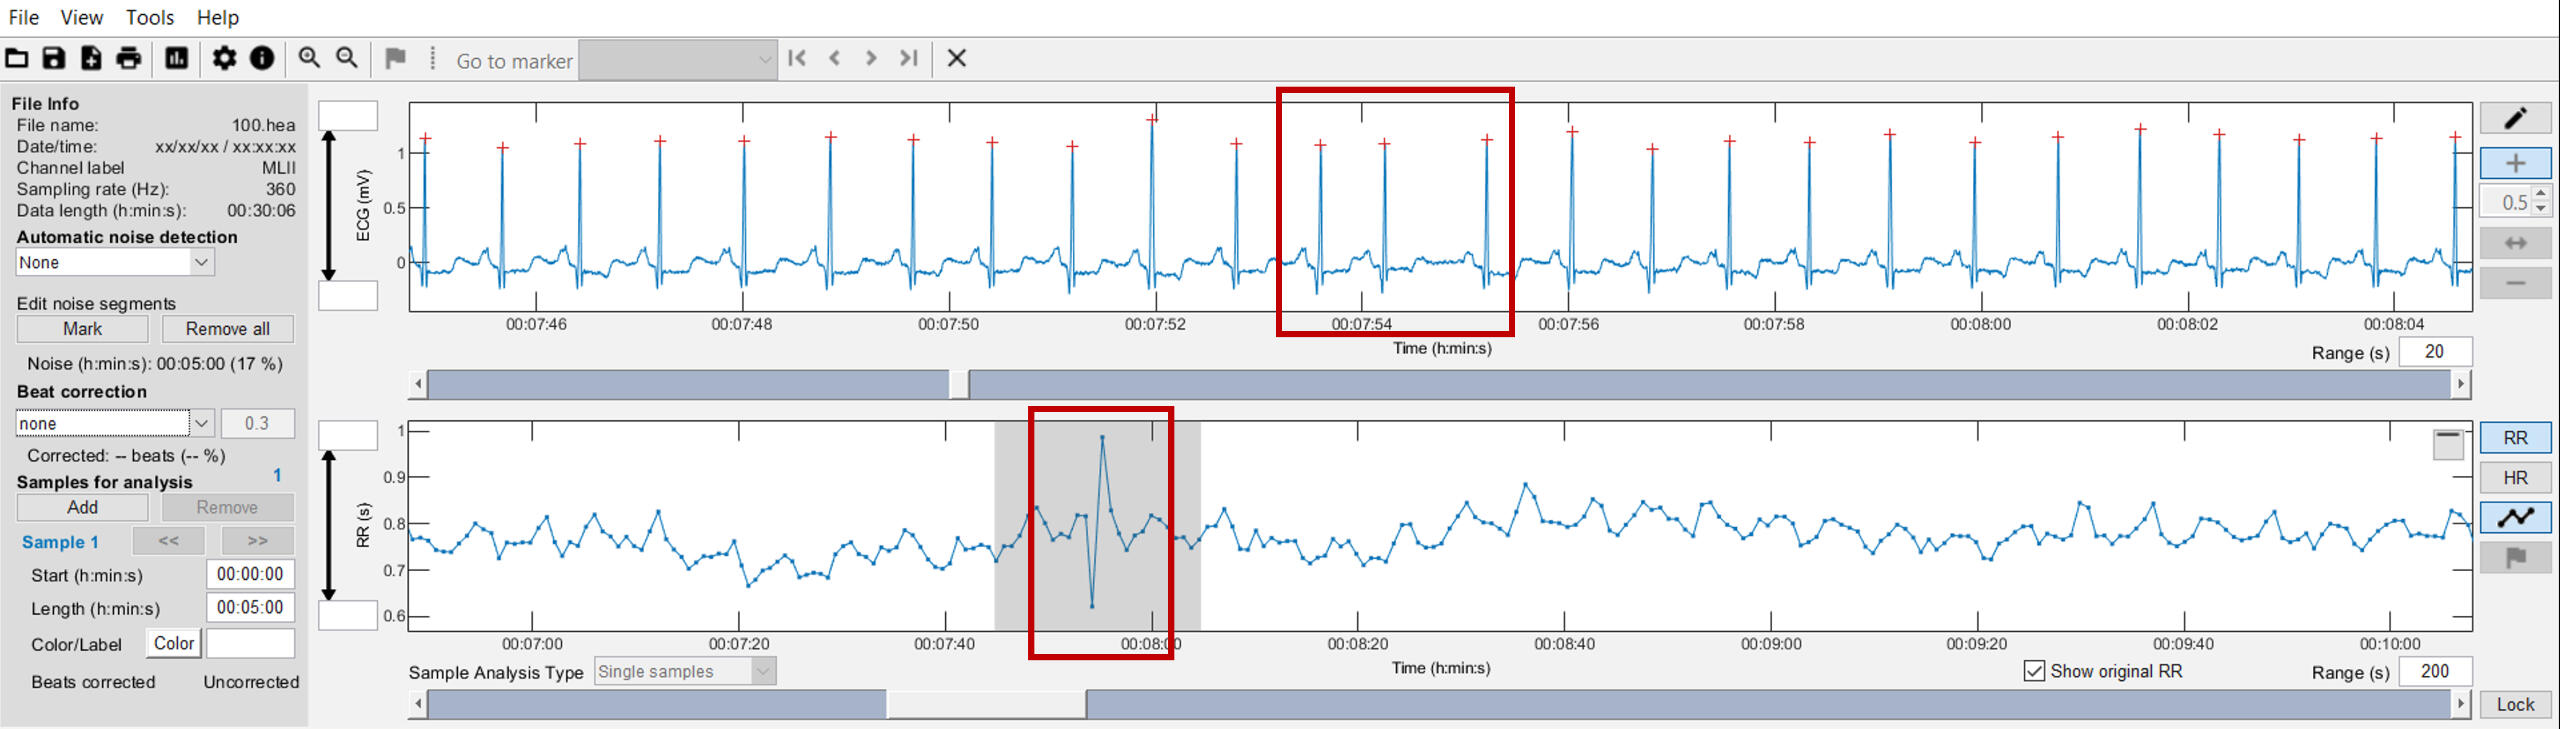

Further, three categories of RR interval detection errors based on comparison between RR intervals provided by software (red circles) and visual investigation of ECG signals from Rahel Gilgen-Ammann (2019, click on the picture):

Signal strength and chest belt sensor placement
In addition to a purely device based lack of precision, RR measurement may also depend on which particular ECG lead is chosen for analysis. Significant variation in both RR measurement and conventional HRV indexes was seen depending on ECG lead selection. After searching for standards regarding device validation studies for RR interval detection, there appears to be a lack of consensus on ECG lead selection as to what constitutes the “gold standard”. Chest belt recordings are most similar to ECG lead 2, but certainly are not identical. Although this has not been examined for DFAa1, an example may shed light on this issue seen in the figure below. Depending on the particular ECG lead analyzed, slightly different DFAa1 values but only minimal differences in HRVT determination can be seen (based on DFAa1 crossing a value of 0.75). It is also possible that even with equivalent monitoring precision and R peak detection, changing sensor pad placement can alter DFAa1 measurement to a variable degree. This is apparent in the figure where there is some divergence in data points between ECG lead 2 and V3 and both chest strap devices. This dissimilarity may stem from person to person variation in the cardiac axis, leading to slight ECG waveform changes depending on the signal sampling location:


Various factors could affect DFAa1 values. Since this index depends upon fractal correlation properties of beat-to-beat intervals, precise measurement and proper algorithmic processing is essential. Therefore, excess artifact correction, suboptimal preprocessing (detrending of data) and poor R wave detection can all bias the DFAa1 value, resulting in erroneous intensity feedback and internal load management. Along the path of seeking better DFAa1 accuracy, we noted that depending on ECG electrode placement, different DFAa1 values can occur. More recently, while looking at 12 lead ECG exercise ramp recordings, we were astonished that depending on the lead selected to import into Kubios HRV software, quite different DFAa1 kinetics were calculated.Depending on where on the body we measure the electrical activity of a cardiac cycle, different waveform shapes will be produced. There is also a concept called axis deviation - axis referring to the net electrical activity observed. If one heart chamber enlarges, the axis may change. It can also change with breathing. It has been shown that ECG lead placement does have an effect on both waveform signal and conventional HRV indexes. Comparison of different leads was conducted in the past which shows that lead 2 is the closest to standard belt placed in the center of the chest.

We can see that the voltages and "sharpness" of the R peak are all very different. Although lead 2 did have a better R peak than most, there was tremendous variability in signal voltage (especially lead 3 which is in a location very "near" lead 2). This was reflected in the differences between an averaged value (based on all leads) and each individual lead. Although they conjectured about the respiratory change, it is well known that cardiac axis will shift with respiration. Cardiac axis as noted above, is the net electrical direction of heart muscle electrical activity. Cardiac axis (and therefore waveform) will change during breathing and position. Therefore, ECG waveform distortion is potentially caused by actual cardiac axis shift when the measurement belt is in that particular location.It has been shown that RR intervals and HRV can be different depending on the various leads in a resting ECG. This may be due to alteration in waveform shape, voltage (signal strength) and cardiac axis shifts. These difference may be magnified during position change and especially respiration due to shifts in cardiac axis. For the majority of users, a center belt position is probably fine. However, if one is seeing a lower DFAa1 on a regular basis than should be the case, a slight rotation of the belt to the left may be something to try. This rotation could provide a more symmetrical waveform also increasing signal strength. Rotation of the belt to the right is not recommended.A participant in one of our studies was wearing both an Polar H10 and Movesense Medical sensor (with the potential to record a single lead ECG tracing) during a session, cycling near a first physiological threshold. We were analyzing the time series and noted that DFAa1 appeared way too low for the intensity performed. A look at the ECG waveform from the Movesense Medical sensor data revealed that the bulk of the signal voltage was negative (left picture below)! One would think that Kubios HRV software would auto invert this waveform (especially since that was chosen in the preferences) but it does not. After reimporting the data with "reversed polarity", R peak detection and waveform was enhanced (right picture below). This impacted also the calculation of related DFAa1 values.
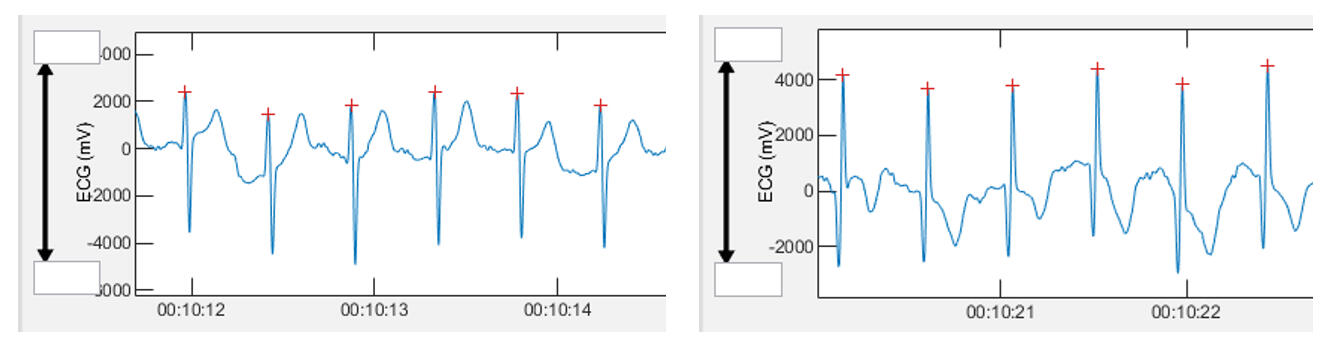
This example illustrates several points. First, Kubios HRV software auto polarity selection sometimes does not work as it should. After the evaluation of the parallel used Polar H10 data, we also saw that this device does not have the ability to auto sense optimal polarity - we will need to do this ourselves! Simple signal inversion (polarity reversal) can lead to substantial DFAa1 changes.
Optimization of signal strength and waveform
To check signal strength and waveform you will either need the Fatmaxxer app (Android), the ECG Logger app (Android, iOS), the Polar Sensor Logger app (Android), or the ECG Recorder app (iOS), all for Polar H10 chest belt device. There may be other options for the PC as well.
Use cream or electrode gel on the belt sensor pads. Try module centered with Polar logo right side up (default position). Analyze the wave - if it looks good (R peak sharp with minimal negative waveform) you are probably good to go. If the negative part of the wave is greater than the positive - try just inverting the module upside down. Repeat analysis (after inversion). Optional - move the module 2 to 3 cm at a time to the left, potentially as far as the nipple and measure the waveform at each site. Compare all measurements and find the best choice for you. Although we don’t know how common this type of issue is, it probably occurs more often than we think. Going forward with DFAa1 monitoring, we recommend an initial signal optimization protocol to help produce the most precise DFAa1 values. Besides the issue of proper software detrending (as e.g., Runalyze, Fatmaxxer and AI Endurance are doing), signal optimization may help you reproduce published findings.Polar has several information regarding sensor placement and usage on their website (click on the picture below), but has now deleted the information about sensor placement adjustments and about potentially inverting the module on the chest belt to enhance signal strength.

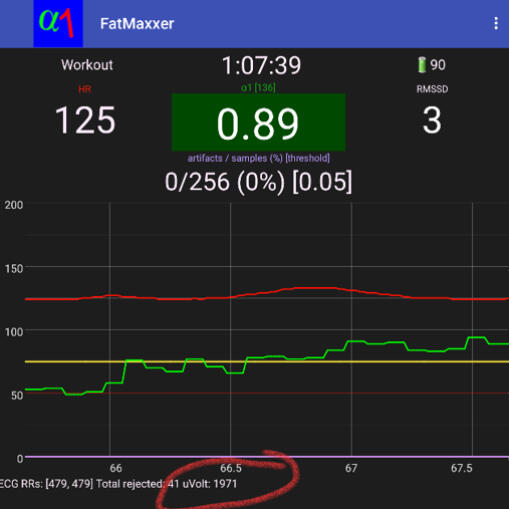
The developer of Fatmaxxer Ian Peake has graciously added a feature to help us decide on optimum signal strength without the need to graph out the ECG. The peak R voltage is now displayed (see below in red circle) beat to beat. This is accurate as long as noise is not present. My recommendation would be to try various belt positions at rest, wait several seconds for the signal to stabilize, then note the voltage. If you are seeing artifacts detected, that could be a sign of more noise or signal distortion (so wait for no artifacts). Find the best voltage and then monitor it as you exercise. It should not change very much. Try to aim for above 1000 µV. If you are seeing <500 µV, chances are that the HRV and even heart rate may not be captured properly. If you are interested, a visual approach is still the best in our opinion, but this gives us a quick, accurate option.Having ECG output is indispensable. It's important to both optimize signal strength, waveform shape and perhaps most importantly, differentiate noise artifact vs. arrhythmia. If you do see aberrant beats, consider manual beat deletion if the DFAa1 curve is atypical. Therefore, inspection of the ECG signal is essential in order to better understand and reduce artifacts. If only RR intervals can be detected, it is recommended to inspect time-varying DFAa1 data in order to explain implausible values with the help of RR intervals and artifact correction and, if necessary, to exclude them.
Settings recommendations for the Fatmaxxer app:
Artifact threshold of 5% during exercise (25% at rest) - the reason being that both choices will correct missed beats but only the 5% will correct the dreaded premature beat (APC) which is not uncommon during exertion.
There is now an auto mode feature that I would recommend - it adjusts the 5 or 25% according to heart rate which makes life much easier (no need to reset the limits for resting or exercise conditions).
Recalculation window of 5 to 20 seconds.
For runners the sound function is ideal. The app will voice notify over wired or wireless headphones with your heart rate and DFAa1 - perfect for running, skiing and when you can't look at your phone.
Notification on so your operating system does not force close the app. Screen on for cycling.
Except for audio setting, you will need a restart for settings to change.
The app now has an auto bluetooth pairing function. Choose the menu item "search for Polar devices". Your last or preferred device will also show on the menu.
Menu - Rename current logs - if you want to save the .csv with DFAa1 and heart rate or RR interval raw data, this is very useful - you can custom name the session before, or during the session before quitting the app.
Menu - Export - you can export the logs (RR or "features" which contains the DFAa1 and heart rate details. In addition, an export of ECG tracings (snippets) with artefact containment can be helpful for artefact assessment. Having the custom name makes this much easier, since the time coding name can be confusing, especially with many logs.
Menu - Delete all logs - after weeks or months, you can delete the logs you don't need.
At the bottom of the settings there is developer mode. If this is on, the app will not begin recording data on start (until you purposefully connect to the chest belt). This is useful if you want to "replay" an old session.
Replay RR data log - a very cool function that imports previous sessions RR data back in redoing the graphs. You will get a dialog box asking which file to import.
Signal voltage check - circled in red above.
The axis on the left represents heart rate and DFAa1 x 100 (so a 0.75 is 75 on the scale). The right axis is the artifact in percent. The digital display contains artifacts, elapsed time, heart rate and DFAa1 in the middle. RMSSD is also in the digital display. Files are saved as both RR intervals and time stamped DFAa1, heart rate, and artifacts.
A recent validation study could provide reasonable agreement of Fatmaxxer with the established standard of Kubios HRV software:

Rogers et al. (2025): "Though some small differences may exist between Fatmaxxer and Kubios derived DFAa1, it is apparent that the correlation between the two methods is robust and consistent over diverse comparison approaches (HRVTs, constant interval, incremental ramp). Users wishing to use DFAa1 in real-time or even in retrospect can be reassured that Fatmaxxer obtained values will be very well aligned with Kubios HRV software, at least in similar participant demographics and testing conditions as seen in the current study.This is underscored by the close matching of HRVT values and individual DFAa1 incremental ramp responses. Furthermore, the recent proposal to use only ramp data limited to the moderate to heavy domain to determinethe “predicted” HRVT2 corresponding to the heavy-severe boundary, appears to be feasible using Fatmaxxer data as the delimiter of ramp termination. That said, for research purposes or when “gold standard” precision is required, importation of the RR series into Kubios software would be recommended for higher accuracy. It should be noted that at low DFAa1 ranges (< 0.5), the bias seen with Fatmaxxer may be clinically relevant under certain circumstances. For example, in cases where intensity is near the heavy-severe boundary, the difference between values of 0.50 and 0.55 may be deemed important. As the Fatmaxxer app is restricted to recording data from the Polar H10 sensor exclusively, usage of other HR monitoring devices is excluded. While the H10 device has been validated to provide relatively precise DFAa1 results compared to a 500 Hz sample rate ECG, the inability to interface with other HRV recording tools is a limitation of the app. In summary, for most field and consumer related purposes, it is difficult to see how the small amount of bias seen with Fatmaxxer would be of physiological relevance. Moreover, this degree of variability could still be expected on a day-to-day basis. In contrast, since there are definite, though subtle differences between these two apps, Kubios HRV would hold an advantage for research uses."
Relating accuracy, the HRV software needs to first "detrend" the data. This has nothing to do with "detrended fluctuation analysis" (DFA). The detrending of RR data is done to remove "stationaries". These are slow changes in beat pattern from other causes. If they are not removed properly, the DFAa1 will appear more "ordered" than it should be and a bias upward will be seen at very low values. This has been the bugaboo of some of the other software approaches including the initial python related packages. For instance, Runalyze was somewhat inaccurate before they enhanced their approach to using the "smoothness priors" approach of the Kubios HRV software. The HRV Logger app does not use the "smoothness priors". However, we saw very good accuracy with the HRV Logger app in our case study of a former Olympian triathlete. After a fair amount of work, Fatmaxxer has been significantly upgraded to use the Kubios HRV software method of "smoothness priors". Despite the calculation load, the speed is not affected even with a re-computation of every 5 seconds.
Influence of sample rate
There have been several publications examining the importance of sample rates for HRV and even DFAa1. They do not indicate huge disparities in results comparing rates of 128 and 1000 Hz. But, they have been done at rest and no study has looked at what happens during exercise. The problem with lower sample rates is that the waveform loses some smoothness and definition. Remember, with the lower sample rate, less information about the wave structure is present.Here are a few examples of ECG tracings with different sample rates:
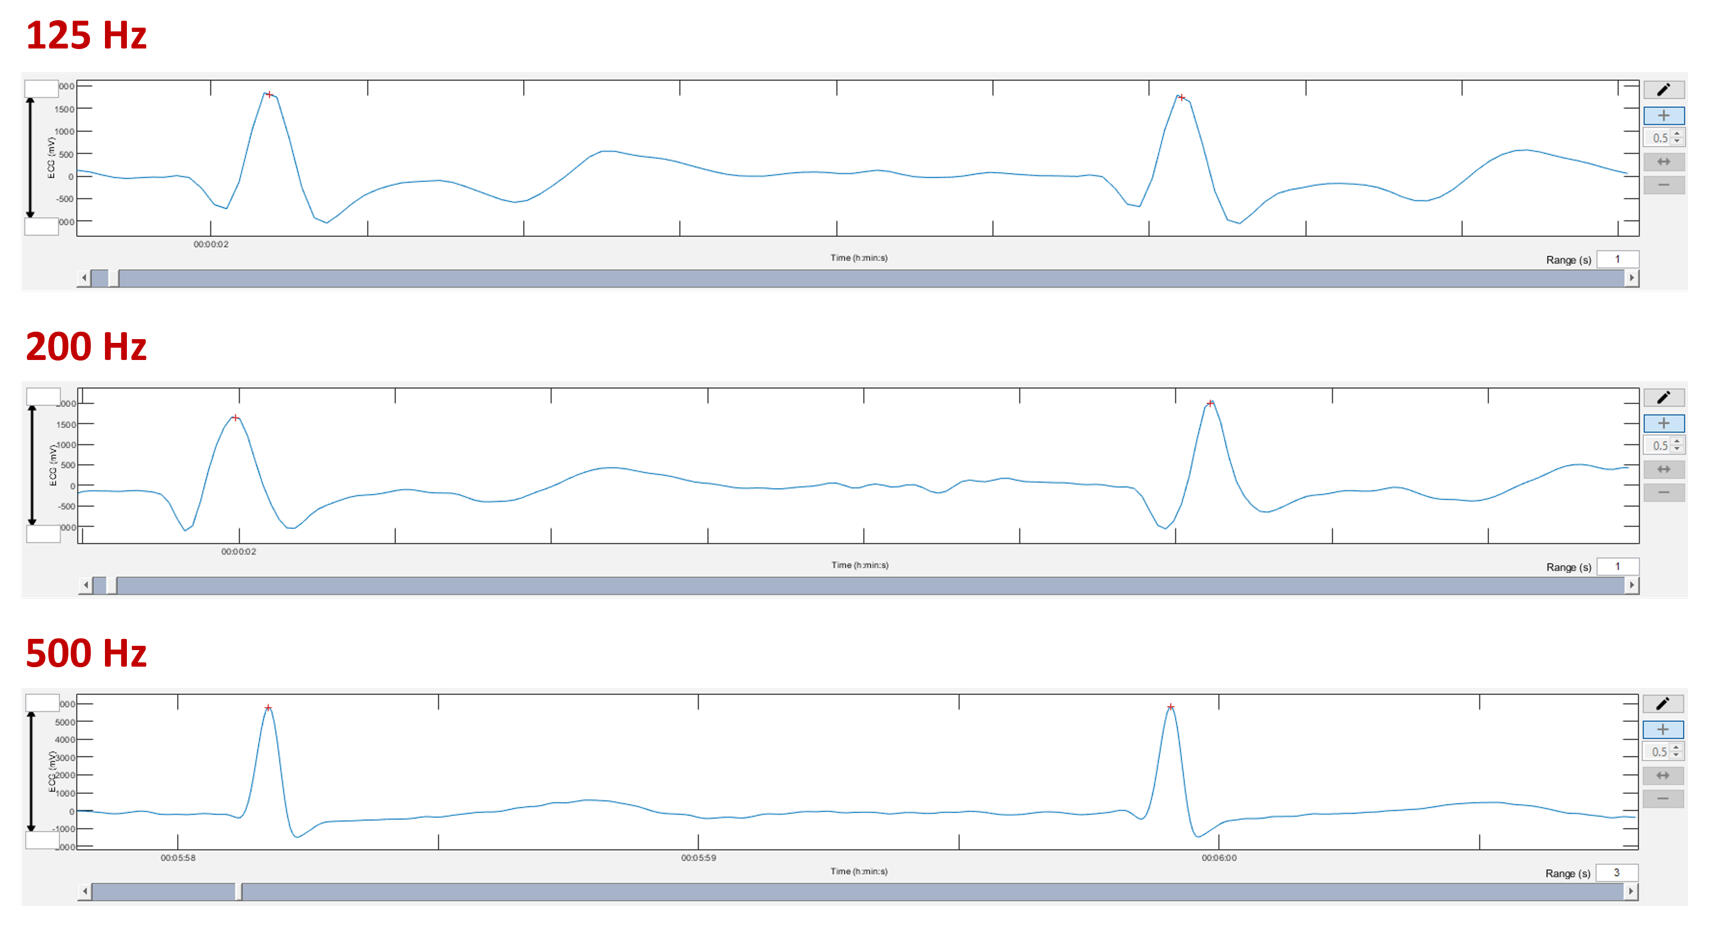
Here is a Hexoskin sample from Bruce Rogers taken from the .wav file using Audacity. This is a great example of a low-ish sample rate (256 Hz). Each data point that makes up the waveform structure is now exposed.
Our concern was that the lower sample rates could affect an index of self similarity (DFAa1) if the level of fine detail was lost. In addition, the distortion of the wave (tilt left or right) could also lead to some change in the RR interval timing. Therefore, at least 256 Hz and higher are recommend vor non-linear analysis of HRV.In a well known study the aim was to see what happened to various HRV indexes if there was a loss of RR interval precision. In other words, would the HRV index change if the R peaks were not precise. That's going to happen in either low sample rate conditions or with waveform distortion. The data showed downward bias in the DFAa1 value during light exercise (intensity below VT1 with DFAa1 baseline about 1.0). The bias was not as severe with a resting RR tracing. I suspect that with DFAa1 values near 0.5, the bias would be even worse than noted:

What does this mean on a practical basis? It appears that inaccurate assessment of the R peak by either ECG distortion, low sample rate or by a conventional chest belt can impact the precision of the DFAa1 calculation. This is not something that can be necessarily corrected by software since it's essentially based upon the loss of information. For example, a blurry photo can't be corrected by Photoshop (ask any good photographer). DFAa1 is based on fractal correlation properties of the RR time series. As in a detailed map of a coastline, loss of the map's dot to dot precision will change the fractal nature of that given coastline. Since we are at the very beginning of really understanding the specific use case prerequisites in having one achieve a valid calculation, further work needs to be done to address these issues. One scenario is clear, use of photoplethysmography (PPG) based RR data should not be deemed trustworthy until proved otherwise.
Other factors affecting DFAa1 kinetics
We have previously noted DFAa1 decline associated with poor waveform and have had multiple "complaints" of DFAa1 reading too low at easy intensity levels during certain forms of exercise in certain people. The most common example being running. Why would running give us a distorted R peak? Here is an informative view of chest wall motion during running:

As you can see there is quite a bit of motion and sensor bounce going on (click on the picture below). Whether this is part of the issue is unclear, but it does make one wonder. It seems to be due to some sort of electromechanical interference related to impact. In addition, the volume is rapidly changing, which could lead to variation in the ECG signal strength.We described this behaviour in one of our studies with Bas van Hooren (2023): "In the present data, we also observed inappropriate suppression of HRV correlation properties in one of the individuals losing dynamic range of DFAa1 despite good ECG waveform and little artefact. In this case, the DFAa1 value was already markedly suppressed at the commencement of running (DFAa1 < 0.5) and stayed suppressed until the walking transition. The reason for this behaviour is unclear, but possible causes include oscillation of the cardiac axis (and therefore the precision of the RR measurement) due to foot strike-related impact. Overall, these findings highlight that further improvements in technology may be helpful to ensure robust functioning of this method for usage during in-field applications."

From a network physiology standpoint, we must also keep in mind that DFAa1 is a reflection of net ANS activity and “organismic demand” of the systemic internal load. Therefore, changes in ambient temperature, fraction of inspired oxygen, intentional change of breathing frequency, hydration, nutritional status, and systemic illness can all play a role in modulating DFAa1 behavior. Lastly, though ANS balance appears to be the major determinant of DFAa1 behavior, locomotor-respiratory and cardiac coupling mechanisms and other non-neural mechanisms may also play a part. Finally, a major requisite of using pre-defined values of DFAa1 as a marker of exercise intensity is the need for uniform HRV software methodology in its calculation. One should also not expect exact similarity of results if different preprocessing methods from Kubios HRV or other software applications are used for calculations.
What are future directions?
A question that has eluded study thus far is whether DFAa1 behavior in male versus female participants is the same. Scant data exists at present showing HRVT similarity to the aerobic threshold in females as opposed to males. In addition, no information exists comparing DFAa1 response during exercise in pre- vs. post-menopausal women and along different phases of the menstrual cycle. From a theoretical standpoint, differences in DFAa1 response during exercise are possible in hormonally active women as several studies show altered HRV between the sexes. More specifically, autonomic balance appears to change over the course of the menstrual cycle as opposed to a lack of change in cardiorespiratory parameters. An additional area of interest is HRVT validity in other sport-specific settings, especially regarding the influence of upper body activity on signal quality and differences in DFAa1 calculation (e.g., skiing, swimming, rowing), and over diverse age groups which would be helpful for widespread usage. In addition, consequences of intermittent positional bounce such as seen with running could be examined since they do have the potential to alter the cardiac axis, thereby affecting ECG waveform morphology. Another question is whether the improvement of DFAa1 per unit of power or pace after a training intervention can indicate enhanced fitness, particularly in threshold boundaries. First data showed potential, but additional research is needed. Prospective training intervention studies of participants who utilize knowledge of DFAa1 behavior during the early stage of routine exercise sessions for training guidance (as shown in monitoring with time domain HRV values during rest conditions) would be of great interest as a tool to determine daily “readiness to train”. Finally, analysis of DFAa1 kinetics during prolonged and incremental exercise, as well as methodological advancements such as DDFA and scaling behavior in relation to the window length considered for analysis of the data should be examined.
Practical conclusions and recommendations
Studies of fractal correlation properties of heart rate variability during exercise have produced important findings over the past ten years. DFAa1 behavior is a reflection of ANS regulation and is a component of network physiology which encompasses multiple neuromuscular, biochemical, peripheral and central nervous system inputs leading to an overall index of “organismic demand”. DFAa1 threshold determination can be affected by artifact correction and recording device bias but under most circumstances has enough resiliency to be of practical value with consumer grade heart rate monitors used for RR interval detection. Both web-based and real-time smartphone tracking apps have been developed for DFAa1 monitoring and physiologic exercise threshold determination. Many of the current applications use similar computational methodology as the industry analysis standard of Kubios HRV software. Finally, while of value when even viewed in isolation, DFAa1 tracking in combination with external load markers such as power or pace open intriguing possibilities regarding athlete durability, identification of endurance exercise fatigue and optimization of daily training guidance.
A summary presentation in German language on the current state of research can be accessed via the following link. This presentation was given at the exercise and training science conference „Optimizing Training in Sports, Exercise and Health“ of the German Association for Sports Science in Cologne in 2023:

Summary of practical recommendations:
Use Kubios HRV Premium (Scientific) software or other with similar features for retrospective analysis; “Smoothness priors” (Lambda = 500), “automatic” correction, DFAa1 window width of 4 ≤ n ≤ 16 beats, 2-minute analysis window.
Exclude data with >3-5 % artefact containment.
Use ECG records (e.g., single channel tracings with Movesense Medical sensor) to get deeper insights into artefact sources; otherwise RR interval only data lose some of these valuable information.
Get a feel for the data through time varying results with a rolling window of 2 minutes every 1-10 seconds; especially when using only RR interval raw data.
For real-time analysis, experiment with different scenarios and back-up your DFAa1 data with other objective and/or subjective internal load data (e.g., heart rate, blood lactate, rating of perceived exertion) at first, and also according to external load (power, pace); use Polar H10 chest belt device and the Fatmaxxer app or Garmin alphaHRV data field for practical settings.
If you are seeing many artifacts using ANT+, try switching to bluetooth for specific devices; the Polar H10 has a nice feature that enables two different devices to simultaneously receive RR interval packets over bluetooth. It is not enabled by default so you will need to do so. You can find the instructions by clicking on the picture below.
Once enabled you can have your Garmin watch and the appropriate app (or other bluetooth device) receive data at the same time. This applies to ANT+ as well. Using the „Polar Beat“ app, you can turn off multi device bluetooth and/or ANT+ at will. Note: on Polar H10 battery change (or pull) these settings will be lost! You will need to reapply with the app.

Potential pitfalls in a nutshell (please read above for further details):
Device type and measuring principle, variations in belt or ECG lead placement; impact on reliability.
Effects of footstrike impact and missed beats due to partial chest belt contact; impact on ECG waveform and RR interval period.
Observation of inappropriate suppression of DFAa1 losing dynamic range despite good ECG waveform and little artefact.
Influence of internal (e.g., arrhythmias) and external factors (e.g., environment).
Motion- or EMG-related noise and poor ECG waveform amplitude (voltage), contributing to the failure of RR recognition - signal-to-noise ratio could be improved by either moving the chest belt to the left or inverting the recording module.
Influence of breathing interventions, the need for a “free running system” due to coupling mechanism.
Further improvements in technology may be helpful to ensure robust functioning of this method for usage in in-field applications.
Bibliography
Below you will find a bibliography of reviews and methodological articles, as well as exercise-related studies and DFAa1; I have also compiled an overview of the conceptual and signal-theoretical background.
Reviews and methodological studies related to DFAa1 during acute physical exercise:
Gronwald, T., & Hoos, O. (2020). Correlation properties of heart rate variability during endurance exercise: A systematic review. Annals of Noninvasive Electrocardiology, 25(1), e12697. https://doi.org/10.1111/anec.12697
Gronwald, T., Rogers, B., & Hoos, O. (2020). Fractal Correlation Properties of Heart Rate Variability: A New Biomarker for Intensity Distribution in Endurance Exercise and Training Prescription? Frontiers in Physiology, 11, 550572. https://doi.org/10.3389/fphys.2020.550572
Gronwald, T. Hoos, O. & Hottenrott, K. (2021). Analyse von Korrelationseigenschaften der Herzfrequenzzeitreihe während ausdauer-akzentuierter Belastungen: Perspektiven für Diagnostik und Trainingssteuerung. In K. Hottenrott, I. Böckelmann & H. Schmidt (Hrsg.), Herzfrequenzvariabilität: Anwendungen in Forschung & Praxis (S. 114-136). Hamburg: Czwalina. [https://www.researchgate.net/publication/373990000AnalysevonKorrelationseigenschaftenderHerzfrequenzzeitreihewahrendausdauer-akzentuierterBelastungenPerspektivenfurDiagnostikund_Trainingssteuerung]
Rogers, B., Giles, D., Draper, N., Mourot, L., & Gronwald, T. (2021). Influence of Artefact Correction and Recording Device Type on the Practical Application of a Non-Linear Heart Rate Variability Biomarker for Aerobic Threshold Determination. Sensors, 21(3), 821. https://doi.org/10.3390/s21030821
Rogers, B., & Gronwald, T. (2022). Fractal Correlation Properties of Heart Rate Variability as a Biomarker for Intensity Distribution and Training Prescription in Endurance Exercise: An Update. Frontiers in Physiology, 13, 879071. https://doi.org/10.3389/fphys.2022.879071
Rogers, B., Schaffarczyk, M., Clauß, M., Mourot, L., & Gronwald, T. (2022). The Movesense Medical Sensor Chest Belt Device as Single Channel ECG for RR Interval Detection and HRV Analysis during Resting State and Incremental Exercise: A Cross-Sectional Validation Study. Sensors, 22(5), 2032. https://doi.org/10.3390/s22052032
Rogers, B., Murias, J. M., & Fleitas-Paniagua, P. R. (2025). Validity of an open-source mobile app to measure fractal correlation properties of heart rate variability during exercise. European journal of applied physiology, 10.1007/s00421-025-06037-0. Advance online publication. https://doi.org/10.1007/s00421-025-06037-0
Schaffarczyk, M., Rogers, B., Reer, R., & Gronwald, T. (2022). Validity of the Polar H10 Sensor for Heart Rate Variability Analysis during Resting State and Incremental Exercise in Recreational Men and Women. Sensors, 22(17), 6536. https://doi.org/10.3390/s22176536
Hoos, O., & Gronwald, T. (2025). Detrended fluctuation analysis of heart rate variability during exercise: Time to reconsider the theoretical and methodological background. Comment on: Cassirame et al.`s (2025) Detrended fluctuation analysis to determine physiologic thresholds, investigation and evidence from incremental cycling test. European Journal of Applied Physiology, 125, 523–533. https://doi.org/10.1007/s00421-025-05859-2
Studies related to DFAa1 during and after acute physical exercise:
Ajayi, O. O., van Rassel, C. R., Jordan, M. J., & MacInnis, M. J. (2025). Non-linear heart rate variability is sensitive to exercise duration but not indicative of acute performance decrement. European Journal of Applied Physiology, 10.1007/s00421-025-05846-7. Advance online publication. https://doi.org/10.1007/s00421-025-05846-7
Alikhani, I., Noponen, K., Tulppo, M., Peltonen, J., Lehtonen, E., & Seppanen, T. (2022). Heart Rate Variability and its Association with Second Ventilatory Threshold Estimation in Maximal Exercise Test. 44th Annual International Conference of the IEEE Engineering in Medicine & Biology Society (EMBC), 139–142. https://doi.org/10.1109/embc48229.2022.9871913
Andriolo, S., Rummel, M., & Gronwald, T. (2024). Relationship of Cycling Power and Non-Linear Heart Rate Variability from Everyday Workout Data: Potential for Intensity Zone Estimation and Monitoring. Sensors, 24(14), 4468. https://doi.org/10.3390/s24144468
Bardet, J.-M., Kammoun, I., & Billat, V. (2012). A new process for modeling heartbeat signals during exhaustive run with an adaptive estimator of its fractal parameters. Journal of Applied Statistics, 39(6), 1331–1351. https://doi.org/10.1080/02664763.2011.646962
Bernaola-Galván, P. A., Gómez-Extremera, M., Romance, A. R., & Carpena, P. (2017). Correlations in magnitude series to assess nonlinearities: Application to multifractal models and heartbeat fluctuations. Physical Review E, 96(3). https://doi.org/10.1103/physreve.96.032218
Billat, V. L., Mille-Hamard, L., Meyer, Y., & Wesfreid, E. (2009). Detection of changes in the fractal scaling of heart rate and speed in a marathon race. Physica A: Statistical Mechanics and Its Applications, 388(18), 3798-3808. https://doi.org/10.1016/j.physa.2009.05.029
Billat, V. L., Wesfreid, E., Kapfer, C., Koralsztein, J. P., & Meyer, Y. (2006). Nonlinear Dynamics of Heart Rate and Oxygen Uptake in Exhaustive 10,000 m Runs: Influence of Constant vs. Freely Paced. The Journal of Physiological Sciences, 56(1), 103–111. https://doi.org/10.2170/physiolsci.r2028
Blasco-Lafarga, C., Camarena, B., & Mateo-March, M. (2017). Cardiovascular and Autonomic Responses to a Maximal Exercise Test in Elite Youngsters. International Journal of Sports Medicine, 38(09), 666–674. https://doi.org/10.1055/s-0043-110680
Boullosa, D., Barros, E., del Rosso, S., Nakamura, F., & Leicht, A. (2014). Reliability of Heart Rate Measures during Walking before and after Running Maximal Efforts. International Journal of Sports Medicine, 35(12), 999-1005. https://doi.org/10.1055/s-0034-1372637
BuSha, B. F. (2010). Exercise modulation of cardiorespiratory variability in humans. Respiratory Physiology & Neurobiology, 172(1–2), 72–80. https://doi.org/10.1016/j.resp.2010.05.002
Canino, M. C., Dunn-Lewis, C., Proessl, F., LaGoy, A. D., Hougland, J. R., Beck, A. L., Vaughan, G. P., Sterczala, A. J., Connaboy, C., Kraemer, W. J., & Flanagan, S. D. (2022). Finding a rhythm: Relating ultra-short-term heart rate variability measures in healthy young adults during rest, exercise, and recovery. Autonomic Neuroscience, 239, 102953. https://doi.org/10.1016/j.autneu.2022.102953
Cassirame, J., Eustache, E., Garbellotto, L., Chevrolat, S., Gimenez, P., & Leprêtre, P. M. (2025). Detrended fluctuation analysis to determine physiologic thresholds, investigation and evidence from incremental cycling test. European journal of applied physiology, 125(2), 523–533. https://doi.org/10.1007/s00421-024-05614-z
Casties, J.-F., Mottet, D., & Gallais, D. L. (2006). Non-Linear Analyses of Heart Rate Variability During Heavy Exercise and Recovery in Cyclists. International Journal of Sports Medicine, 27(10), 780–785. https://doi.org/10.1055/s-2005-872968
Castiglioni, P., Parati, G., Civijian, A., Quintin, L., & Di Rienzo, M. (2009). Local Scale Exponents of Blood Pressure and Heart Rate Variability by Detrended Fluctuation Analysis: Effects of Posture, Exercise, and Aging. IEEE Transactions on Biomedical Engineering, 56(3), 675–684. https://doi.org/10.1109/tbme.2008.2005949
Chan, H.-L., Lin, L.-Y., Lin, M.-A., Fang, S.-C., & Lin, C.-H. (2007). Nonlinear characteristics of heart rate variability during unsupervised and steady physical activities. Physiological Measurement, 28(3), 277–286. https://doi.org/10.1088/0967-3334/28/3/004
Chen, S.-W., Liaw, J.-W., Chang, Y.-J., Chan, H.-L., & Chiu, L.-Y. (2015). A Cycling Movement Based System for Real-Time Muscle Fatigue and Cardiac Stress Monitoring and Analysis. PLOS ONE, 10(6), e0130798. https://doi.org/10.1371/journal.pone.0130798
Chen, S.-W., Liaw, J.-W., Chang, Y.-J., Chuang, L.-L., & Chien, C.-T. (2015). Combined heart rate variability and dynamic measures for quantitatively characterizing the cardiac stress status during cycling exercise. Computers in Biology and Medicine, 63, 133–142. https://doi.org/10.1016/j.compbiomed.2015.05.026
Fennell, C. R. J., Mauger, A. R., & Hopker, J. G. (2024). Inter-day reliability of heart rate complexity and variability metrics in healthy highly active younger and older adults. European Journal of Applied Physiology, 124(5), 1409–1424. https://doi.org/10.1007/s00421-023-05373-3
Fleitas-Paniagua, P. R., de Almeida Azevedo, R., Trpcic, M., Murias, J. M., & Rogers, B. (2024). Combining Near-Infrared Spectroscopy and Heart Rate Variability Derived Thresholds to Estimate the Critical Intensity of Exercise. Journal of Strength and Conditioning Research, 38(1), e16–e24. https://doi.org/10.1519/JSC.0000000000004597
Fleitas-Paniagua, P. R., de Almeida Azevedo, R., Trpcic, M., Murias, J. M., & Rogers, B. (2023). Effect of ramp slope on intensity thresholds based on correlation properties of heart rate variability during cycling. Physiological reports, 11(15), e15782. https://doi.org/10.14814/phy2.15782
Fleitas-Paniagua, P. R., Marinari, G., Rasica, L., Rogers, B., & Murias, J. M. (2024). Heart Rate Variability Thresholds: Agreement with Established Approaches and Reproducibility in Trained Females and Males. Medicine & Science in Sports & Exercise, 56(7), 1317–1327. https://doi.org/10.1249/MSS.0000000000003412
Gómez-Extremera, M., Bernaola-Galván, P. A., Vargas, S., Benítez-Porres, J., Carpena, P., & Romance, A. R. (2018). Differences in nonlinear heart dynamics during rest and exercise and for different training. Physiological Measurement, 39(8), 084008. https://doi.org/10.1088/1361-6579/aad929
Goya-Esteban, R., Barquero-Pérez, O., Sarabia-Cachadina, E., de la Cruz-Torres, B., Naranjo-Orellana, J., & Rojo-Alvarez, J. L. (2012, September). Heart rate variability non linear dynamics in intense exercise. In 2012 Computing in Cardiology (pp. 177-180). IEEE.
Gronwald, T., Berk, S., Altini, M., Mourot, L., Hoos, O., & Rogers, B. (2021). Real-Time Estimation of Aerobic Threshold and Exercise Intensity Distribution Using Fractal Correlation Properties of Heart Rate Variability: A Single-Case Field Application in a Former Olympic Triathlete. Frontiers in Sports and Active Living, 3, 668812. https://doi.org/10.3389/fspor.2021.668812
Gronwald, T., Hoos, O., & Hottenrott, K. (2019a). Effects of a Short-Term Cycling Interval Session and Active Recovery on Non-Linear Dynamics of Cardiac Autonomic Activity in Endurance Trained Cyclists. Journal of Clinical Medicine, 8(2), Art. 2. https://doi.org/10.3390/jcm8020194
Gronwald, T., Hoos, O., & Hottenrott, K. (2019b). Effects of Acute Normobaric Hypoxia on Non-linear Dynamics of Cardiac Autonomic Activity During Constant Workload Cycling Exercise. Frontiers in Physiology, 10, 999. https://doi.org/10.3389/fphys.2019.00999
Gronwald, T., Hoos, O., & Hottenrott, K. (2020). Influence Of Performance Level Of Male Runners On Non-linear Dynamics Of Heart Rate Variability During a 10Km Race. International Journal of Performance Analysis in Sport, 20(4), 569–583. https://doi.org/10.1080/24748668.2020.1764746
Gronwald, T., Hoos, O., Ludyga, S., & Hottenrott, K. (2019). Non-linear dynamics of heart rate variability during incremental cycling exercise. Research in Sports Medicine, 27(1), 88–98. https://doi.org/10.1080/15438627.2018.1502182
Gronwald, T., Horn, L., Schaffarczyk, M., & Hoos, O. (2024). Correlation properties of heart rate variability for exercise prescription during prolonged running at constant speeds: A randomized cross‐over trial. European Journal of Sport Science, 24(11), 1539–1551. https://doi.org/10.1002/ejsc.12175
Gronwald, T., Kock, H., Röglin, L., Möhle, M., Kircher, E., Hoos, O., & Ketelhut, S. (2025). Recovery of Linear and Nonlinear Heart Rate Variability Metrics After Short-Term Moderate versus Vigorous Intensity Exercise: A Cross-Sectional Randomized Cross-Over Study. European journal of sport science, 25(11), e70077. https://doi.org/10.1002/ejsc.70077
Gronwald, T., Ludyga, S., Hoos, O., & Hottenrott, K. (2018). Non-linear dynamics of cardiac autonomic activity during cycling exercise with varied cadence. Human Movement Science, 60, 225–233. https://doi.org/10.1016/j.humov.2018.06.013
Gronwald, T., Rogers, B., Hottenrott, L., Hoos, O., & Hottenrott, K. (2021). Correlation Properties of Heart Rate Variability during a Marathon Race in Recreational Runners: Potential Biomarker of Complex Regulation during Endurance Exercise. Journal of Sports Science and Medicine, 557–563. https://doi.org/10.52082/jssm.2021.557
Gronwald, T., Schaffarczyk, M., Fohrmann, D., Hoos, O., & Hollander, K. (2025). Correlation properties and respiratory frequency of ECG‐derived heart rate variability during multiple race‐pace running intervals in female and male long‐distance runners. Physiological Reports, 13(3), e70177. https://doi.org/10.14814/phy2.70177
Hassanein, Y. E., Rogers, B., Ibrahim, D., Fleitas-Paniagua, P. R., Murias, J. M., & Townsend, N. E. (2025). Do Agreements between HRV and Gas Exchange Thresholds Still Hold under Hypoxic Conditions? Medicine & Science in Sports & Exercise, 10.1249/MSS.0000000000003744. Advance online publication. https://doi.org/10.1249/MSS.0000000000003744
Hassanein, Y. E., Rogers, B., Ibrahim, D., Fleitas-Paniagua, P. R., Murias, J. M., & Townsend, N. E. (2025). Do Agreements between HRV and Gas Exchange Thresholds Still Hold under Hypoxic Conditions? Medicine & Science in Sports & Exercise, 57(9), 2062–2072. https://doi.org/10.1249/MSS.0000000000003744
Hautala, A. J., Kiviniemi, A. M., & Tulppo, M. P. (2009). Individual responses to aerobic exercise: The role of the autonomic nervous system. Neuroscience & Biobehavioral Reviews, 33(2), 107–115. https://doi.org/10.1016/j.neubiorev.2008.04.009
Hautala, A. J., Mäkikallio, T. H., Seppänen, T., Huikuri, H. V., & Tulppo, M. P. (2003). Short-term correlation properties of R–R interval dynamics at different exercise intensity levels. Clinical Physiology and Functional Imaging, 23(4), 215–223. https://doi.org/10.1046/j.1475-097X.2003.00499.x
Held, S., Rappelt, L., Wiedenmann, T., Rommelmann, J., Gronwald, T., & Donath, L. (2025). HRV-Based Thresholds in Rowing: Validity and Reliability Assessment. European Journal of Sport Science, 25(10), e70054. https://doi.org/10.1002/ejsc.70054
Hottenrott, K., & Hoos, O. (2017). Heart rate variability analysis in exercise physiology. In ECG time series variability analysis (pp. 249-280). CRC Press.
Ikura, H., Katsumata, Y., Seki, Y., Ryuzaki, T., Shiraishi, Y., Miura, K., Sato, K., & Fukuda, K. (2022). Real-time analysis of heart rate variability during aerobic exercise in patients with cardiovascular disease. IJC Heart & Vasculature, 43, 101147. https://doi.org/10.1016/j.ijcha.2022.101147
Kaltsatou, A., Flouris, A. D., Herry, C. L., Notley, S. R., Seely, A. J. E., Beatty, H. W., & Kenny, G. P. (2020). Age differences in cardiac autonomic regulation during intermittent exercise in the heat. European Journal of Applied Physiology, 120(2), 453–465. https://doi.org/10.1007/s00421-019-04290-8
Kanniainen, M., Laatikainen-Raussi, V., Pukkila, T., Vohlakari, K., Hynynen, E., Ihalainen, J. K., & Räsänen, E. (2025). Threshold estimation in running using dynamical correlations of RR intervals. Physiological reports, 13(9), e70241. https://doi.org/10.14814/phy2.70241
Kanniainen, M., Pukkila, T., Kuisma, J., Molkkari, M., Lajunen, K., & Räsänen, E. (2023). Estimation of physiological exercise thresholds based on dynamical correlation properties of heart rate variability. Frontiers in physiology, 14, 1299104. https://doi.org/10.3389/fphys.2023.1299104
Karasik, R., Sapir, N., Ashkenazy, Y., Ivanov, P. C., Dvir, I., Lavie, P., & Havlin, S. (2002). Correlation Differences in Heartbeat Fluctuations During Rest and Exercise. Physical Review E, 66(6). https://doi.org/10.1103/PhysRevE.66.062902
Karavirta, L., Tulppo, M. P., Laaksonen, D. E., Nyman, K., Laukkanen, R. T., Kinnunen, H., Häkkinen, A., & Häkkinen, K. (2009). Heart Rate Dynamics after Combined Endurance and Strength Training in Older Men. Medicine & Science in Sports & Exercise, 41(7), 1436–1443. https://doi.org/10.1249/MSS.0b013e3181994a91
Kaufmann, S., Gronwald, T., Herold, F., & Hoos, O. (2023). Heart Rate Variability-Derived Thresholds for Exercise Intensity Prescription in Endurance Sports: A Systematic Review of Interrelations and Agreement with Different Ventilatory and Blood Lactate Thresholds. Sports Medicine - Open, 9(1). https://doi.org/10.1186/s40798-023-00607-2
Lewis, M. J., Kingsley, M., Short, A. L., & Simpson, K. (2007). Rate of reduction of heart rate variability during exercise as an index of physical work capacity. Scandinavian Journal of Medicine & Science in Sports, 17(6), 696–702. https://doi.org/10.1111/j.1600-0838.2006.00616.x
Lu, C., Lu, S., Wu, Y., Xing, Q., Pan, B., & Shen, Y. (2025). Estimation of Runners' Lactate Threshold Heart Rate and Speed by Heart Rate Variability. International Journal of Sports Medicine, advance online publication. https://doi.org/10.1055/a-2721-9979
Martinez-Navarro, I., Montoya, A., Mateo-March, M., & Blasco-Lafarga, C. (2021). Heart rate dynamics and lactate following high-intensity race-pace continuous vs interval workouts in highly trained athletes. Physiology International, 108(2), 303–316. https://doi.org/10.1556/2060.2021.00153
Mateo‐March, M., Moya‐Ramón, M., Javaloyes, A., Sánchez‐Muñoz, C., & Clemente‐Suárez, V. J. (2023). Validity of detrended fluctuation analysis of heart rate variability to determine intensity thresholds in elite cyclists. European Journal of Sport Science, 23(4), 580–587. https://doi.org/10.1080/17461391.2022.2047228
Molkkari, M., Angelotti, G., Emig, T., & Räsänen, E. (2020). Dynamical heart beat correlations during running. Scientific reports, 10(1), 13627. https://doi.org/10.1038/s41598-020-70358-7
Naranjo-Orellana, J., Nieto-Jiménez, C., & Ruso-Álvarez, J. F. (2021). Non-linear heart rate dynamics during and after three controlled exercise intensities in healthy men. Physiology International, 107(4), 501–512. https://doi.org/10.1556/2060.2020.00039
Nuuttila, O.-P., Laatikainen-Raussi, V., Vohlakari, K., Laatikainen-Raussi, I., & Ihalainen, J. K. (2025). Durability in recreational runners: Effects of 90-min low-intensity exercise on the running speed at the lactate threshold. European Journal of Applied Physiology, 125(3), 697–705. https://doi.org/10.1007/s00421-024-05631-y
Olieslagers, A., Müller-Jabusch, Y., Vancoillie, M., Delen, E., & de Beukelaar, T. (2026). Agreement between heart rate variability-derived and lactate/ventilatory thresholds during a 4-min stepwise incremental cycling test in male adults. Physiological Reports, 14(4), e70777. https://doi.org/10.14814/phy2.70777
Platisa, M. M., & Gal, V. (2008). Correlation properties of heartbeat dynamics. European Biophysics Journal, 37(7), 1247–1252. https://doi.org/10.1007/s00249-007-0254-z
Platisa, M. M., Mazic, S., Nestorovic, Z., & Gal, V. (2008). Complexity of heartbeat interval series in young healthy trained and untrained men. Physiological Measurement, 29(4), 439–450. https://doi.org/10.1088/0967-3334/29/4/002
Pukkila, T., Molkkari, M., Kanniainen, M., Hernesniemi, J., Nikus, K., Lyytikäinen, L.-P., Lehtimäki, T., Viik, J., Kähönen, M., & Rasanen, E. (2023, October). Effects of Beta Blocker Therapy on RR Interval Correlations During Exercise. Computing in Cardiology Conference (CinC), (Vol. 50, pp. 1-4). IEEE. https://doi.org/10.22489/cinc.2023.104
Rabineau, J., Hedge, E. T., Fournier, R., Mastrandrea, C. J., & Hughson, R. L. (2025). Heart rate variability during exercise can quantify cardiorespiratory deconditioning in 55- to 65-yr-old men and women exposed to head-down bed rest. Journal of Applied Physiology, 138(4), 1002–1010. https://doi.org/10.1152/japplphysiol.00017.2025
Rogers, B. (2020). A Personalized Low Intensity Exercise Prescription based on an Index of Non-Linear Heart Rate Variability: A Case Report. Journal of Athletic Enhancement, 9, 1. https://doi.org/10.37532/jae.2020.9(1).327
Rogers, B., Berk, S., & Gronwald, T. (2022). An Index of Non-Linear HRV as a Proxy of the Aerobic Threshold Based on Blood Lactate Concentration in Elite Triathletes. Sports, 10(2), 25. https://doi.org/10.3390/sports10020025
Rogers, B., Fleitas-Paniagua, P. R., & Murias, J. M. (2024). Improving the Agreement Between the First Heart-Rate-Variability Threshold and the Gas-Exchange Threshold. International Journal of Sports Physiology and Performance, 19(12), 1434–1443. https://doi.org/10.1123/ijspp.2024-0143
Rogers, B., Fleitas-Paniagua, P. R., Trpcic, M., Zagatto, A. M., & Murias, J. M. (2025). Fractal correlation properties of heart rate variability and respiratory frequency as measures of endurance exercise durability. European Journal of Applied Physiology, 125(6), 1619–1631. https://doi.org/10.1007/s00421-025-05716-2
Rogers, B., Giles, D., Draper, N., Hoos, O., & Gronwald, T. (2020). A New Detection Method Defining the Aerobic Threshold for Endurance Exercise and Training Prescription Based on Fractal Correlation Properties of Heart Rate Variability. Frontiers in Physiology, 11, 596567. https://doi.org/10.3389/fphys.2020.596567
Rogers, B., Giles, D., Draper, N., Mourot, L., & Gronwald, T. (2021). Detection of the Anaerobic Threshold in Endurance Sports: Validation of a New Method Using Correlation Properties of Heart Rate Variability. Journal of Functional Morphology and Kinesiology, 6(2), 38. https://doi.org/10.3390/jfmk6020038
Rogers, B., Gronwald, T., & Mourot, L. (2021). Analysis of Fractal Correlation Properties of Heart Rate Variability during an Initial Session of Eccentric Cycling. International Journal of Environmental Research and Public Health, 18(19), 10426. https://doi.org/10.3390/ijerph181910426
Rogers, B., Mourot, L., & Gronwald, T. (2021). Aerobic Threshold Identification in a Cardiac Disease Population Based on Correlation Properties of Heart Rate Variability. Journal of Clinical Medicine, 10(18), 4075. https://doi.org/10.3390/jcm10184075
Rogers, B., Mourot, L., Doucende, G., & Gronwald, T. (2021). Fractal correlation properties of heart rate variability as a biomarker of endurance exercise fatigue in ultramarathon runners. Physiological Reports, 9(14), e14956. https://doi.org/10.14814/phy2.14956
Rogers, B., Murias, J. M., & Fleitas-Paniagua, P. R. (2025). Prediction of the Maximal Metabolic Steady State From Heart Rate Variability Using a Submaximal Incremental Ramp Test. Journal of Strength and Conditioning Research. Advance online publication. https://doi.org/10.1519/JSC.0000000000005196
Rogers, B., Schaffarczyk, M., & Gronwald, T. (2023). Improved Estimation of Exercise Intensity Thresholds by Combining Dual Non-Invasive Biomarker Concepts: Correlation Properties of Heart Rate Variability and Respiratory Frequency. Sensors, 23(4), 1973. https://doi.org/10.3390/s23041973
Schaffarczyk, M., Rogers, B., Reer, R., & Gronwald, T. (2022). Fractal correlation properties of HRV as a noninvasive biomarker to assess the physiological status of triathletes during simulated warm-up sessions at low exercise intensity: A pilot study. BMC Sports Science, Medicine and Rehabilitation, 14(1). https://doi.org/10.1186/s13102-022-00596-x
Schaffarczyk, M., Rogers, B., Reer, R., & Gronwald, T. (2023). Validation of a non-linear index of heart rate variability to determine aerobic and anaerobic thresholds during incremental cycling exercise in women. European Journal of Applied Physiology, 123(2), 299–309. https://doi.org/10.1007/s00421-022-05050-x
Sempere-Ruiz, N., Manresa-Rocamora, A., Fuertes-Kenneally, L., Sanz-Rocher, A., Baladzhaeva, S., Climent-Payá, V., Moya-Ramón, M., & Sarabia, J. M. (2025). Detection of exercise intensity thresholds in patients with chronic heart failure based on correlation properties of heart rate variability. European Journal of Applied Physiology. Advance online publication. https://doi.org/10.1007/s00421-025-05860-9
Sempere-Ruiz, N., Sarabia, J. M., Baladzhaeva, S., & Moya-Ramón, M. (2024). Reliability and validity of a non-linear index of heart rate variability to determine intensity thresholds. Frontiers in Physiology, 15, 1329360. https://doi.org/10.3389/fphys.2024.1329360
Sheoran, S., Stavropoulos-Kalinoglou, A., Darrall-Jones, J., & Weaving, D. (2025). Internal training exposure: Development and construct validation of an individualised method using heart rate variability. European Journal of Applied Physiology. Advance online publication. https://doi.org/10.1007/s00421-025-05841-y
Sheoran, S., Stavropoulos-Kalinoglou, A., Simpson, C., Ashby, M., Webber, E., & Weaving, D. (2024). Exercise intensity measurement using fractal analysis of heart rate variability: Reliability, agreement and influence of sex and cardiorespiratory fitness. Journal of Sports Sciences, 42(21), 2012–2020. https://doi.org/10.1080/02640414.2024.2421691
Tanner, V., Millet, G. P., & Bourdillon, N. (2024). Agreement Between Heart Rate Variability - Derived vs. Ventilatory and Lactate Thresholds: A Systematic Review with Meta-Analyses. Sports Medicine - Open, 10(1). https://doi.org/10.1186/s40798-024-00768-8
Tanoue, Y., Nakashima, S., Komatsu, T., Kosugi, M., Kawakami, S., Kawakami, S., Michishita, R., Higaki, Y., & Uehara, Y. (2023). The Validity of Ultra-Short-Term Heart Rate Variability during Cycling Exercise. Sensors, 23(6), 3325. https://doi.org/10.3390/s23063325
Tulppo, M. P., Hautala, A. J., Mäkikallio, T. H., Laukkanen, R. T., Nissilä, S., Hughson, R. L., & Huikuri, H. V. (2003). Effects of aerobic training on heart rate dynamics in sedentary subjects. Journal of Applied Physiology, 95(1), 364–372. https://doi.org/10.1152/japplphysiol.00751.2002
Tulppo, M. P., Hughson, R. L., Mäkikallio, T. H., Airaksinen, K. E. J., Seppänen, T., & Huikuri, H. V. (2001). Effects of exercise and passive head-up tilt on fractal and complexity properties of heart rate dynamics. American Journal of Physiology-Heart and Circulatory Physiology, 280(3), H1081–H1087. https://doi.org/10.1152/ajpheart.2001.280.3.H1081
Van Hooren, B., Bongers, B. C., Rogers, B., & Gronwald, T. (2023). The Between-Day Reliability of Correlation Properties of Heart Rate Variability During Running. Applied Psychophysiology and Biofeedback, 48(4), 453–460. https://doi.org/10.1007/s10484-023-09599-x
Van Hooren, B., Mennen, B., Gronwald, T., Bongers, B. C., & Rogers, B. (2025). Correlation properties of heart rate variability to assess the first ventilatory threshold and fatigue in runners. Journal of Sports Sciences, 43(2), 125–134. https://doi.org/10.1080/02640414.2023.2277034
van Rassel, C. R., Ajayi, O. O., Sales, K. M., Clermont, C. A., Rummel, M., & MacInnis, M. J. (2025). Quantifying exercise intensity with fractal correlation properties of heart rate variability: A study on incremental and constant-speed running. European Journal of Applied Physiology, 125(1), 91–102. https://doi.org/10.1007/s00421-024-05592-2
Zimatore, G., Gallotta, M. C., Campanella, M., Skarzynski, P. H., Maulucci, G., Serantoni, C., De Spirito, M., Curzi, D., Guidetti, L., Baldari, C., & Hatzopoulos, S. (2022). Detecting Metabolic Thresholds from Nonlinear Analysis of Heart Rate Time Series: A Review. International Journal of Environmental Research and Public Health, 19(19), 12719. https://doi.org/10.3390/ijerph191912719
Methodological and signal-theoretical background:
Almurad, Z. M. H., & Delignières, D. (2016). Evenly spacing in Detrended Fluctuation Analysis. Physica A: Statistical Mechanics and Its Applications, 451, 63–69. https://doi.org/10.1016/j.physa.2015.12.155
Arsac, L. M., & Deschodt-Arsac, V. (2018). Detrended fluctuation analysis in a simple spreadsheet as a tool for teaching fractal physiology. Advances in Physiology Education, 42(3), 493–499. https://doi.org/10.1152/advan.00181.2017
Chen, Z., Ivanov, P. Ch., Hu, K., & Stanley, H. E. (2002). Effect of nonstationarities on detrended fluctuation analysis. Physical Review E, 65(4), 041107. https://doi.org/10.1103/PhysRevE.65.041107
Costa, M. D., Davis, R. B., & Goldberger, A. L. (2017). Heart Rate Fragmentation: A New Approach to the Analysis of Cardiac Interbeat Interval Dynamics. Frontiers in Physiology, 8, 255. https://doi.org/10.3389/fphys.2017.00255
de Godoy, M. (2016). Nonlinear Analysis of Heart Rate Variability: A Comprehensive Review. Journal of Cardiology and Therapy, 3(3), 528–533. https://doi.org/10.17554/j.issn.2309-6861.2016.03.101-4
Dekker, J. M., Schouten, E. G., Klootwijk, P., Pool, J., Swenne, C. A., & Kromhout, D. (1997). Heart Rate Variability from Short Electrocardiographic Recordings Predicts Mortality from All Causes in Middle-aged and Elderly Men: The Zutphen Study. American Journal of Epidemiology, 145(10), 899–908. https://doi.org/10.1093/oxfordjournals.aje.a009049
Delignieres, D., & Marmelat, V. (2012). Fractal Fluctuations and Complexity: Current Debates and Future Challenges. Critical Reviews in Biomedical Engineering, 40(6), 485–500. https://doi.org/10.1615/CritRevBiomedEng.2013006727
Eke, A., Herman, P., Kocsis, L., & Kozak, L. R. (2002). Fractal characterization of complexity in temporal physiological signals. Physiological Measurement, 23(1), R1–R38. https://doi.org/10.1088/0967-3334/23/1/201
Francis, D. P., Willson, K., Georgiadou, P., Wensel, R., Davies, L. C., Coats, A., & Piepoli, M. (2002). Physiological basis of fractal complexity properties of heart rate variability in man. The Journal of Physiology, 542(2), 619–629. https://doi.org/10.1113/jphysiol.2001.013389
Germán-Salló, Z., & Germán-Salló, M. (2016). Non-linear Methods in HRV Analysis. Procedia Technology, 22, 645–651. https://doi.org/10.1016/j.protcy.2016.01.134
Glass, L. (1991). Nonlinear dynamics of physiological function and control. Chaos: An Interdisciplinary Journal of Nonlinear Science, 1(3), 247–250. https://doi.org/10.1063/1.165836
Glass, L., Lerma, C., & Shrier, A. (2011). New Methods for the Analysis of Heartbeat Behavior in Risk Stratification. Frontiers in Physiology, 2, 88. https://doi.org/10.3389/fphys.2011.00088
Goldberger A. L. (1992). Fractal mechanisms in the electrophysiology of the heart. IEEE engineering in medicine and biology magazine : the quarterly magazine of the Engineering in Medicine & Biology Society, 11(2), 47–52. https://doi.org/10.1109/51.139036
Goldberger, A. L. (1996). Non-linear dynamics for clinicians: Chaos theory, fractals, and complexity at the bedside. The Lancet, 347(9011), 1312–1314. https://doi.org/10.1016/S0140-6736(96)90948-4
Goldberger, A. L. (2006). Giles F. Filley Lecture. Complex Systems. Proceedings of the American Thoracic Society, 3(6), 467–471. https://doi.org/10.1513/pats.200603-028MS
Goldberger, A. L., Rigney, D. R., & West, B. J. (1990). Chaos and fractals in human physiology. Scientific American, 262(2), 42–49. https://doi.org/10.1038/scientificamerican0290-42
Hardstone, R., Poil, S.-S., Schiavone, G., Jansen, R., Nikulin, V. V., Mansvelder, H. D., & Linkenkaer-Hansen, K. (2012). Detrended Fluctuation Analysis: A Scale-Free View on Neuronal Oscillations. Frontiers in Physiology, 3, 450. https://doi.org/10.3389/fphys.2012.00450
Havlin, S., Buldyrev, S. V., Bunde, A., Goldberger, A. L., Ivanov, P. Ch., Peng, C.-K., & Stanley, H. E. (1999). Scaling in nature: From DNA through heartbeats to weather. Physica A: Statistical Mechanics and Its Applications, 273(1–2), 46–69. https://doi.org/10.1016/s0378-4371(99)00340-4
Henriques, T., Ribeiro, M., Teixeira, A., Castro, L., Antunes, L., & Costa-Santos, C. (2020). Nonlinear Methods Most Applied to Heart-Rate Time Series: A Review. Entropy, 22(3), 309. https://doi.org/10.3390/e22030309
Heymans, O., Fissette, J., Vico, P., Blacher, S., Masset, D., & Brouers, F. (2000). Is fractal geometry useful in medicine and biomedical sciences? Medical Hypotheses, 54(3), 360–366. https://doi.org/10.1054/mehy.1999.0848
Huikuri, H. V., & Stein, P. K. (2013). Heart Rate Variability in Risk Stratification of Cardiac Patients. Progress in Cardiovascular Diseases, 56(2), 153–159. https://doi.org/10.1016/j.pcad.2013.07.003
Huikuri, H. V., Mäkikallio, T. H., & Perkiömäki, J. (2003). Measurement of heart rate variability by methods based on nonlinear dynamics. Journal of Electrocardiology, 36, 95–99. https://doi.org/10.1016/j.jelectrocard.2003.09.021
Huikuri, H. V., Mäkikallio, T. H., Peng, C.-K., Goldberger, A. L., Hintze, U., & Møller, M. (2000). Fractal Correlation Properties of R-R Interval Dynamics and Mortality in Patients With Depressed Left Ventricular Function After an Acute Myocardial Infarction. Circulation, 101(1), 47–53. https://doi.org/10.1161/01.CIR.101.1.47
Huikuri, H. V., Perkiömäki, J. S., Maestri, R., & Pinna, G. D. (2009). Clinical impact of evaluation of cardiovascular control by novel methods of heart rate dynamics. Philosophical Transactions of the Royal Society A: Mathematical, Physical and Engineering Sciences, 367(1892), 1223–1238. https://doi.org/10.1098/rsta.2008.0294
Ivanov, P. C., Amaral, L. A. N., Goldberger, A. L., & Stanley, H. E. (1998). Stochastic feedback and the regulation of biological rhythms. Europhysics Letters (EPL), 43(4), 363–368. https://doi.org/10.1209/epl/i1998-00366-3
Ivanov, P. C., Amaral, L. A. N., Goldberger, A. L., Havlin, S., Rosenblum, M. G., Struzik, Z. R., & Stanley, H. E. (1999). Multifractality in human heartbeat dynamics. Nature, 399(6735), 461–465. https://doi.org/10.1038/20924
Ivanov, P. C., Nunes Amaral, L. A., Goldberger, A. L., Havlin, S., Rosenblum, M. G., Stanley, H. E., & Struzik, Z. R. (2001). From 1/f noise to multifractal cascades in heartbeat dynamics. Chaos, 11(3), 641–652. https://doi.org/10.1063/1.1395631
Ivanov, P. C., Rosenblum, M. G., Peng, C. K., Mietus, J., Havlin, S., Stanley, H. E., & Goldberger, A. L. (1996). Scaling behaviour of heartbeat intervals obtained by wavelet-based time-series analysis. Nature, 383(6598), 323–327. https://doi.org/10.1038/383323a0
Kantelhardt, J. W., Koscielny-Bunde, E., Rego, H. H. A., Havlin, S., & Bunde, A. (2001). Detecting Long-range Correlations with Detrended Fluctuation Analysis. Physica A: Statistical Mechanics and Its Applications, 295(3–4), 441–454. https://doi.org/10.1016/S0378-4371(01)00144-3
Karasik, R., Sapir, N., Ashkenazy, Y., Ivanov, P. C., Dvir, I., Lavie, P., & Havlin, S. (2002). Correlation Differences in Heartbeat Fluctuations During Rest and Exercise. Physical Review E, 66(6), 062902. https://doi.org/10.1103/PhysRevE.66.062902
Kleiger, R. E., Stein, P. K., & Bigger, J. T. (2005). Heart Rate Variability: Measurement and Clinical Utility. Annals of Noninvasive Electrocardiology, 10(1), 88–101. https://doi.org/10.1111/j.1542-474x.2005.10101.x
Krstacic, G., Krstacic, A., Smalcelj, A., Milicic, D., & Jembrek‐Gostovic, M. (2007). The Chaos Theory and Nonlinear Dynamics in Heart Rate Variability Analysis: Does it Work in Short‐Time Series in Patients with Coronary Heart Disease? Annals of Noninvasive Electrocardiology, 12(2), 130–136. https://doi.org/10.1111/j.1542-474x.2007.00151.x
Kunz, V. C., Borges, E. N., Coelho, R. C., Gubolino, L. A., Martins, L. E. B., & Silva, E. (2012). Linear and nonlinear analysis of heart rate variability in healthy subjects and after acute myocardial infarction in patients. Brazilian Journal of Medical and Biological Research, 45(5), 450–458. https://doi.org/10.1590/s0100-879x2012007500025
Lipsitz, L. A. (1995). Age-related changes in the ‘‘complexity’’ of cardiovascular dynamics: A potential marker of vulnerability to disease. Chaos, 5(1), 102–109. https://doi.org/10.1063/1.166091
Macklem, P. T. (2008). Emergent phenomena and the secrets of life. Journal of Applied Physiology, 104(6), 1844–1846. https://doi.org/10.1152/japplphysiol.00942.2007
Mandelbrot, B. (1967). How Long Is the Coast of Britain? Statistical Self-Similarity and Fractional Dimension. Science, 156(3775), 636–638. https://doi.org/10.1126/science.156.3775.636
Nakamura, Y., Yamamoto, Y., & Muraoka, I. (1993). Autonomic control of heart rate during physical exercise and fractal dimension of heart rate variability. Journal of Applied Physiology, 74(2), 875–881. https://doi.org/10.1152/jappl.1993.74.2.875
Pakenas, A. (2007). Non-linear dynamics and physical exercise: Concepts and applications. Rev Bras Med Esporte, 13(5), 331-335.
Peng, C. ‐K., Havlin, S., Stanley, H. E., & Goldberger, A. L. (1995). Quantification of scaling exponents and crossover phenomena in nonstationary heartbeat time series. Chaos: An Interdisciplinary Journal of Nonlinear Science, 5(1), 82–87. https://doi.org/10.1063/1.166141
Peng, C., Hausdorff, J. M., & Goldberger, A. L. (2000). Fractal mechanisms in neuronal control: Human heartbeat and gait dynamics in health and disease. In J. Walleczek (Hrsg.), Self-Organized Biological Dynamics and Nonlinear Control (1. Aufl., S. 66–96). Cambridge University Press. https://doi.org/10.1017/CBO9780511535338.006
Peng, C.-K., Mietus, J., Hausdorff, J. M., Havlin, S., Stanley, H. E., & Goldberger, A. L. (1993). Long-range anticorrelations and non-Gaussian behavior of the heartbeat. Physical Review Letters, 70(9), 1343–1346. https://doi.org/10.1103/physrevlett.70.1343
Perkiömäki, J. S. (2011). Heart Rate Variability and Non-Linear Dynamics in Risk Stratification. Frontiers in Physiology, 2, 81. https://doi.org/10.3389/fphys.2011.00081
Perkiömäki, J. S., Mäkikallio, T. H., & Huikuri, H. V. (2000). Nonlinear Analysis of Heart Rate Variability: Fractal and Complexity Measures of Heart Rate Behavior. Annals of Noninvasive Electrocardiology, 5(2), 179–187. https://doi.org/10.1111/j.1542-474X.2000.tb00384.x
Perkiömäki, J., Mäkikallio, T., & Huikuri, H. (2005). Fractal and Complexity Measures of Heart Rate Variability. Clinical and Experimental Hypertension, 27(2), 149–158. https://doi.org/10.1081/CEH-200048742
Pikkujämsä, S. M., Mäkikallio, T. H., Sourander, L. B., Räihä, I. J., Puukka, P., Skyttä, J., Peng, C.-K., Goldberger, A. L., & Huikuri, H. V. (1999). Cardiac Interbeat Interval Dynamics From Childhood to Senescence: Comparison of Conventional and New Measures Based on Fractals and Chaos Theory. Circulation, 100(4), 393–399. https://doi.org/10.1161/01.cir.100.4.393
Qu, Z., Hu, G., Garfinkel, A., & Weiss, J. N. (2014). Nonlinear and stochastic dynamics in the heart. Physics Reports, 543(2), 61–162. https://doi.org/10.1016/j.physrep.2014.05.002
Savi, M. A. (2005). Chaos and order in biomedical rhythms. Journal of the Brazilian Society of Mechanical Sciences and Engineering, 27(2). https://doi.org/10.1590/s1678-58782005000200008
Scheffer, M., Bascompte, J., Brock, W. A., Brovkin, V., Carpenter, S. R., Dakos, V., Held, H., van Nes, E. H., Rietkerk, M., & Sugihara, G. (2009). Early-warning signals for critical transitions. Nature, 461(7260), 53–59. https://doi.org/10.1038/nature08227
Seely, A. J., & Macklem, P. T. (2004). Complex systems and the technology of variability analysis. Critical Care, 8(6), R367. https://doi.org/10.1186/cc2948
Sen, J., & McGill, D. (2018). Fractal analysis of heart rate variability as a predictor of mortality: A systematic review and meta-analysis. Chaos, 28(7), 072101. https://doi.org/10.1063/1.5038818
Sharma, V. (2009). Deterministic Chaos and Fractal Complexity in the Dynamics of Cardiovascular Behavior: Perspectives on a New Frontier. The Open Cardiovascular Medicine Journal, 3(1), 110–123. https://doi.org/10.2174/1874192400903010110
Spasić, S. Z., & Kesić, S. (2019). Editorial: Nonlinearity in Living Systems: Theoretical and Practical Perspectives on Metrics of Physiological Signal Complexity. Frontiers in Physiology, 10, 298. https://doi.org/10.3389/fphys.2019.00298
Stanley, H. E., Amaral, L. A. N., Goldberger, A. L., Havlin, S., Ivanov, P. Ch., & Peng, C.-K. (1999). Statistical physics and physiology: Monofractal and multifractal approaches. Physica A: Statistical Mechanics and Its Applications, 270(1–2), 309–324. https://doi.org/10.1016/S0378-4371(99)00230-7
Stein, P. K., Domitrovich, P. P., Huikuri, H. V., Kleiger, R. E., & Cast Investigators. (2005). Traditional and Nonlinear Heart Rate Variability Are Each Independently Associated with Mortality after Myocardial Infarction. Journal of Cardiovascular Electrophysiology, 16(1), 13–20. https://doi.org/10.1046/j.1540-8167.2005.04358.x
Stergiou, N., & Decker, L. M. (2011). Human movement variability, nonlinear dynamics, and pathology: Is there a connection? Human Movement Science, 30(5), 869–888. https://doi.org/10.1016/j.humov.2011.06.002
Struzik, Z. R., Hayano, J., Sakata, S., Kwak, S., & Yamamoto, Y. (2004). 1/f scaling in heart rate requires antagonistic autonomic control. Physical Review E, 70(5), 050901. https://doi.org/10.1103/PhysRevE.70.050901
Tan, C. O. (2013). Heart rate variability: Are there complex patterns? Frontiers in Physiology, 4, 165. https://doi.org/10.3389/fphys.2013.00165
Tapanainen, J. M., Thomsen, P. E. B., Køber, L., Torp-Pedersen, C., Mäkikallio, T. H., Still, A.-M., Lindgren, K. S., & Huikuri, H. V. (2002). Fractal analysis of heart rate variability and mortality after an acute myocardial infarction. The American Journal of Cardiology, 90(4), 347–352. https://doi.org/10.1016/s0002-9149(02)02488-8
Tulppo, M. P., Kiviniemi, A. M., Hautala, A. J., Kallio, M., Seppänen, T., Mäkikallio, T. H., & Huikuri, H. V. (2005). Physiological Background of the Loss of Fractal Heart Rate Dynamics. Circulation, 112(3), 314–319. https://doi.org/10.1161/CIRCULATIONAHA.104.523712
Tulppo, M. P., Makikallio, T. H., Takala, T. E., Seppanen, T., & Huikuri, H. V. (1996). Quantitative beat-to-beat analysis of heart rate dynamics during exercise. American Journal of Physiology-Heart and Circulatory Physiology, 271(1), H244–H252. https://doi.org/10.1152/ajpheart.1996.271.1.H244
Voss, A., Schulz, S., Schroeder, R., Baumert, M., & Caminal, P. (2009). Methods derived from nonlinear dynamics for analysing heart rate variability. Philosophical Transactions of the Royal Society A: Mathematical, Physical and Engineering Sciences, 367(1887), 277–296. https://doi.org/10.1098/rsta.2008.0232
Wagner, C. (1998). Chaos in the cardiovascular system: An update. Cardiovascular Research, 40(2), 257–264. https://doi.org/10.1016/s0008-6363(98)00251-x
Wallot, S., Fusaroli, R., Tylén, K., & Jegindø, E.-M. (2013). Using complexity metrics with R-R intervals and BPM heart rate measures. Frontiers in Physiology, 4, 211. https://doi.org/10.3389/fphys.2013.00211
Weibel, E. R. (1991). Fractal geometry: A design principle for living organisms. American Journal of Physiology-Lung Cellular and Molecular Physiology, 261(6), L361–L369. https://doi.org/10.1152/ajplung.1991.261.6.l361
West, B. J. (2010). Fractal physiology and the fractional calculus: A perspective. Frontiers in Physiology, 1, 12. https://doi.org/10.3389/fphys.2010.00012
Yun, A. J., Bazar, K. A., Gerber, A., Lee, P. Y., & Daniel, S. M. (2005). The dynamic range of biologic functions and variation of many environmental cues may be declining in the modern age: Implications for diseases and therapeutics. Medical Hypotheses, 65(1), 173–178. https://doi.org/10.1016/j.mehy.2004.11.013